Get to $8 000 = walk in the dead zone. Left and right translation.
All right, folks!
Looks like the A-B-C correction scenario is on the stage.
The question of the day is "how deep can we dive?", so I would like to provide a bit of theory before saying the idea.
I would like to submit herewith for your attention the figure 14.15 from the good old book by John J Murhu called "Technical analysis of the financial markets"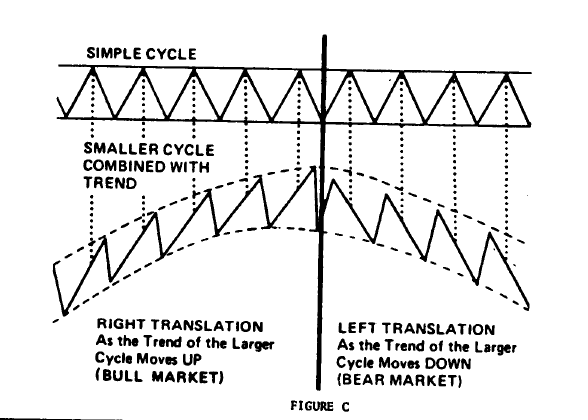
When the longer trend is up, the midpeak shifts to the right. When the longer trend is down, the midpeak shifts to the left, so the right translation is bullish and the left translation is bearish.
Let's have a look at the Nov - Dec 2017 uptrend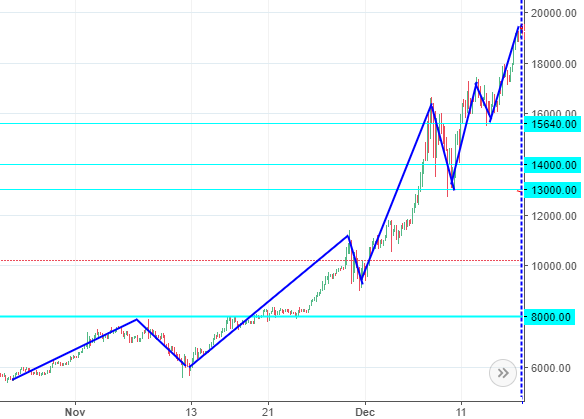
The higher we get to the $20 000 peak - more left moves the midpeak.
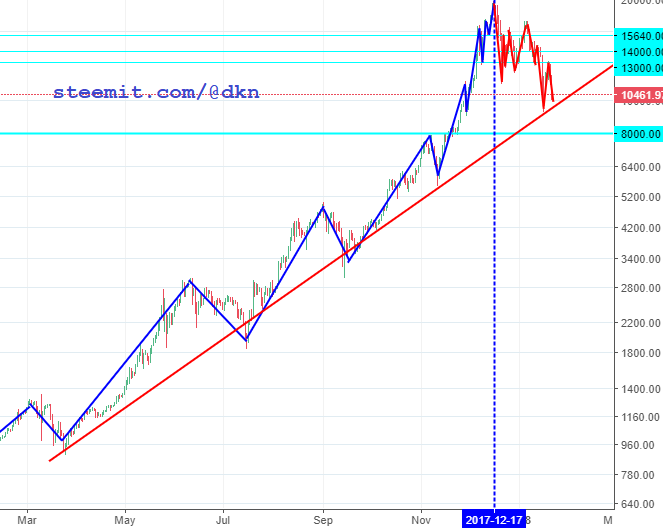
And what we have on our lovely bearish half of the chart?
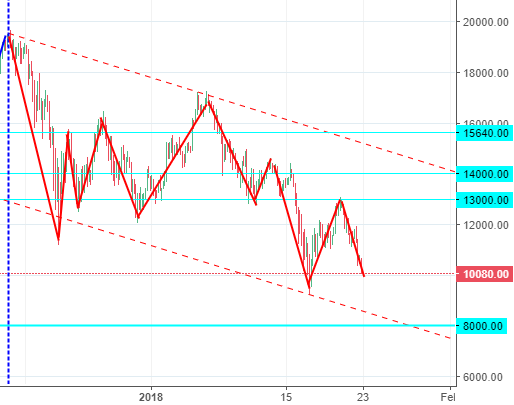
Spaghetti. No structure!
But, it took us 30 days to get from $8 000 to $20 000 and now, on the 36th day of the correction, we see the $8 000 level with no glasses:
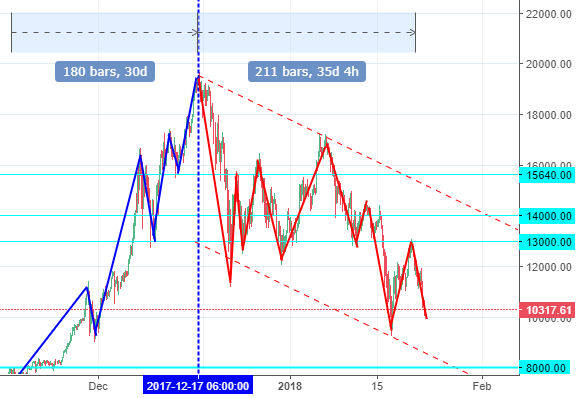
What does it mean? Nothing for now.
And here is one more picture for you. The year of 2017 with logarithmic price axis (our old friend John J Murphy adviced to use it)

Were are now somewhere around drawing the 1-2-3-4-5 wave in C part of the A-B-C correction:
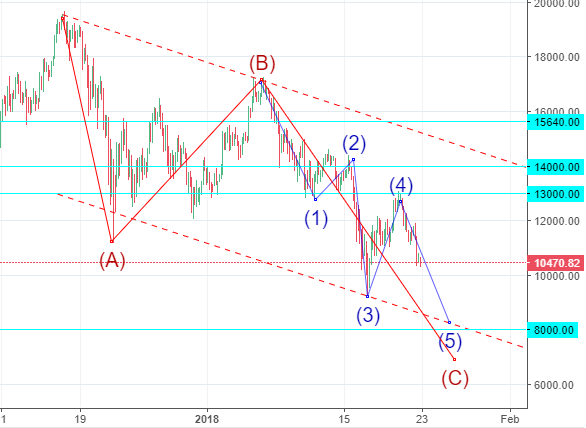
Shall we reach $8 000? If we do, we shall break the trend line:
Thanks for reading my sick fantasies!
To be continued!
P.S
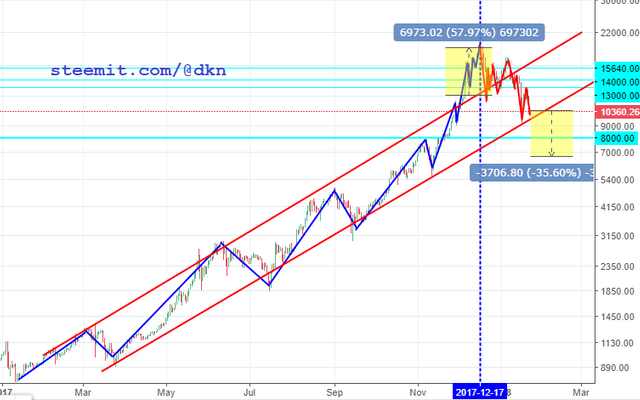
Are you ready for walking in the dead zone, my dear stalkers?
Your count looks very reasonable - just the same levels as we expect... nice job!
Probably, the best EW counter we managed to met at steemit! .. just looked briefly his previous posts. Must Follow!
You make me shy :)
@originalworks
Your Post Has Been Featured on @Resteemable!
Feature any Steemit post using resteemit.com!
How It Works:
1. Take Any Steemit URL
2. Erase
https://3. Type
reGet Featured Instantly – Featured Posts are voted every 2.4hrs
Join the Curation Team Here