Nice graphic showing comparison of Steem's price fall
Just posting an interesting graphic I found here on Steemit by penguinpablo. His post says that people can use his graphics with attribution, so I shouldn't be doing any harm by posting it again. His post contains several more interesting graphics and lots of info, so you should check it out.
Graphic Source:
https://steemit.com/bitcoin/@penguinpablo/bitcoin-new-ath-at-usd5850-less-than-one-day-after-it-broke-usd5000
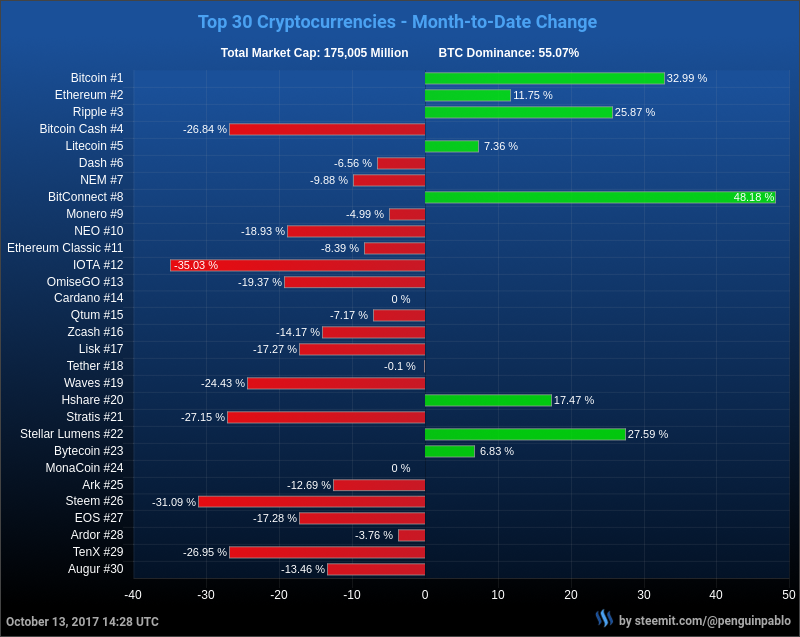
The graph struck me because it shows the huge 30% + drop that Steem has experienced. As I said in a previous post, though, it is nothing new for Steem and it is still, but only just, within its widely fluctuating price boundary as is shown below.
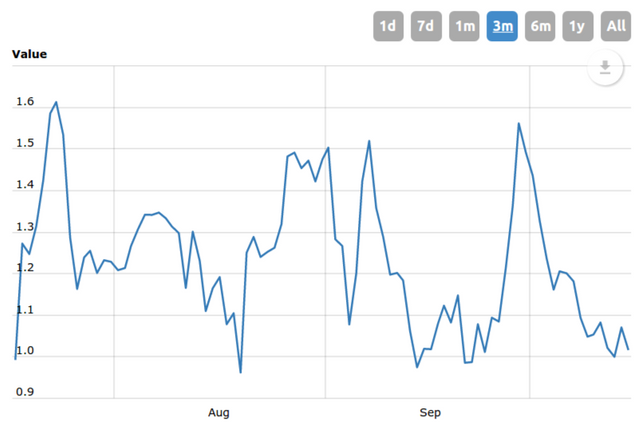
(Image from: www.worldcoinindex.com)
volatility gives opportunities... the price band and almost periodic fluctuations do raise an eyebrow... but it's entirely possible to ride these waves...