A Reason You Shouldn’t Buy The Dip
By John Galt of TheoTrade
Thursday, February 15, 2018 1:03 AM EST
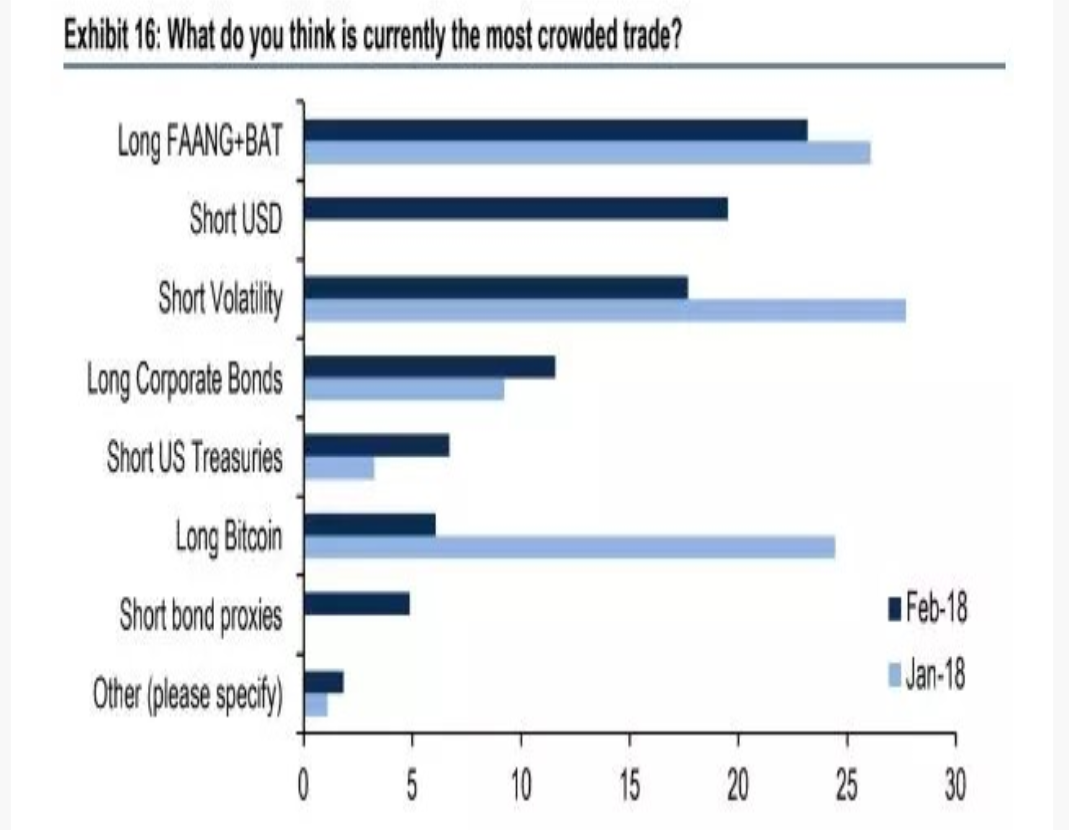
Top Crowded Trades
The chart below shows the fund managers’ opinions on which trades are the most crowded. As you can see, the long bitcoin trade has become a less popular choice which is understandable because it crashed. Surprisingly, my top call ended up being correct. Recently the total cryptocurrency market cap has rallied from $283 billion to $418 billion. That’s a large percentage increase, but it remains in a bear market. In order for it to break the trend of lower highs, it would need to break above $600 billion. I don’t see that occurring based on sentiment. There will always be believers which keep it worth something, but the faddish popularity peak probably will never be reached again. The new trade on this list is the short US dollar trade. It’s ironic to see the short dollar trade take the place of long bitcoin. After having a mini rally a couple weeks ago, the DXY index has fallen about 0.8% in the past 2 days.
I used to think the long oil trade was the most crowded trade, but the recent weakness makes me less likely to pick that one. I’m not saying oil won’t go down from here. It could go down because of the increased supply from shale, but it’s less likely to go down because it’s overcrowded. The current overcrowded trade to me is short treasuries. On Tuesday, the 10 year yield fell by about 3 basis points to 2.83%. However, it has been going up swiftly since September. I’m bearish on treasuries for the intermediate term because of the Fed’s unwind, high deficits, the increased economic growth, and the increase in inflation. However, there needs to be a correction in the trend. The proportion of capital in bonds fell to the lowest level since 1998.
Obviously, the short volatility trade became much less popular after the crash in the short VIX ETFs. This opinion by fund managers that the trade was crowded ended up being correct. Showing how quickly markets trade, I think the VIX will decline in the next few weeks as we return to normalcy after the correction. The VIX declined 2.5% to $24.97 on Tuesday. I don’t agree with the opinion that the long corporate bonds trade is crowded. The LQD investment grade index is at the lowest level since March 2017.
Finally, the long FAANG and BAT trade is considered the most crowded; the total fell slightly in the past month. BAT is Alibaba, Baidu, and Tencent. It’s the Chinese version of the FAANG stocks (Facebook, Apple, Amazon, Google, Netflix). FAANG has become less correlated recently after Alphabet missed earnings expectations. It’s only up 2.54% in the past 3 months; no one would call that performance a signal of an overcrowded trade.

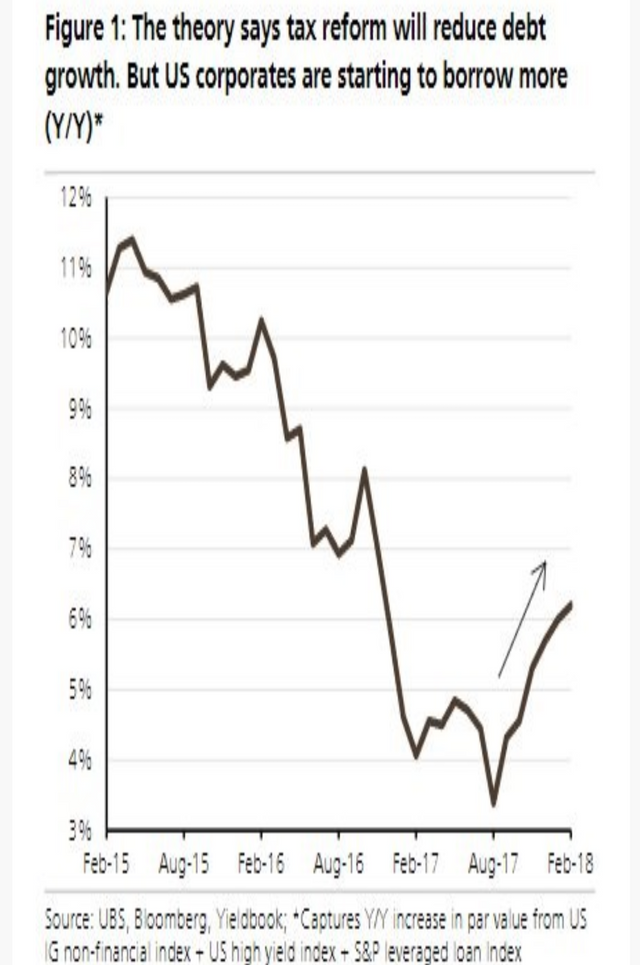
Increase In Corporate Debt
Investors who are worried about the prospect of corporate debt being in a bubble may have thought the decline in tax rates, the repatriated cash coming back to America, and the capping of interest tax deductions would cause firms to borrow less. However, as you can see from the chart below corporate borrowing has started to accelerate year over year in the past few months. Even higher interest rates aren’t stopping growth. My theory is that the year over year comparisons got easier and the economic growth is too strong for it to fall into the negatives.

Don’t Buy The Dip?
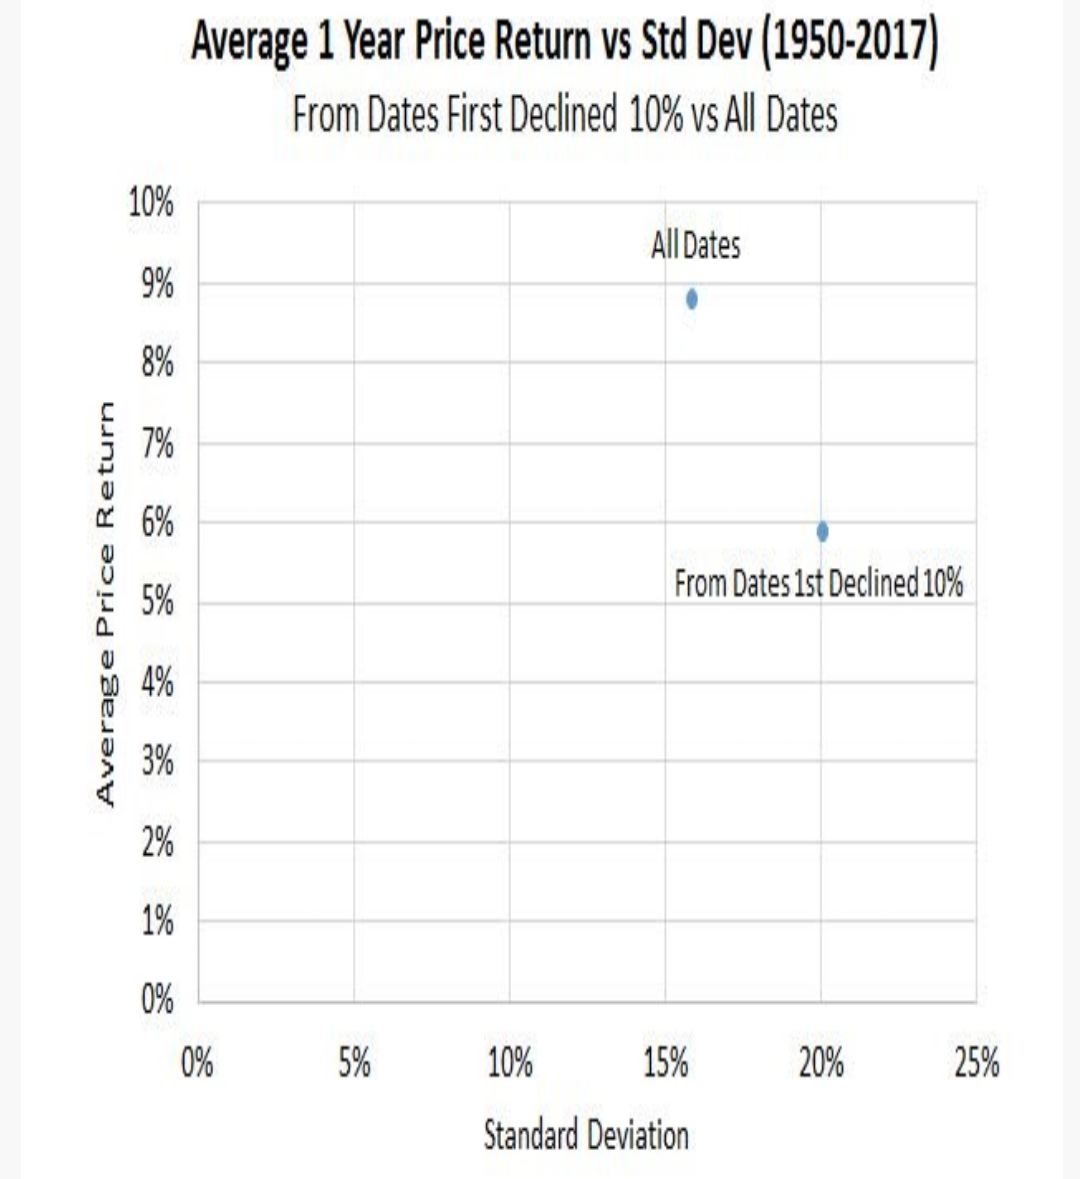
Investors have learned to buy the dips in the past few years. I consider a dip to be 3%-5% down. Since those didn’t occur in 2017, investors bought micro dips, which is any decline less than 3%. The question facing investors now is if they should buy the latest correction which is bigger than the normal bull market dip or sell because a bear market is coming. Obviously, I think the former is the most likely option because of strong economic fundamentals. The chart below shows us the average 1 year price returns and standard deviations after 10% declines going back until 1950. As you can see, the average returns are 6% which is about 3% less than all dates. The standard deviation also is about 5% higher after corrections. If you care about risk adjusted returns, buying stocks after a 10% pullback might not be the best option.
I’m more of a value investor, so I look at stocks going down as a sale like how consumer goods go on sale. If you believe in the efficient market hypothesis than nothing changes no matter where prices go. Whatever happened was caused by a change in the economy or corporate earnings. Considering the fact that trading mechanisms like the short VIX trade blowup occur, I don’t think the market is very efficient. That means I think you can exploit the inefficiencies for profits. Considering how euphoric retail traders got in January, I find it very tough to understand how people believe the stock market is efficient.

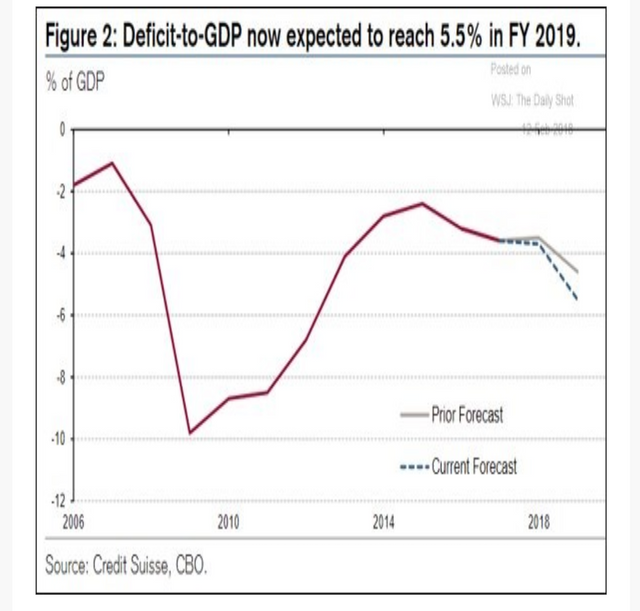
I have mentioned a few times in previous articles that the tax cuts are coming at a weird time because the business cycle is almost over. That is true even more so for the recent $400 billion spending bill. The government is acting like the economy is in a recession or is just coming out of one. Monetary policy has been dovish enough this cycle. Adding all this stimulus will have negative ramifications in the next few years. The first sign of the impacts is the deficit increases which will occur in the next few years. As you can see from the chart below, the deficit as a percentage of GDP hit the cycle low in 2015. I think it increased in 2016 because the economy was weak. It’s a huge problem that the deficit has gotten bigger in 2017 and 2018 when the labor market is at full employment. There probably won’t be a better time for the deficit to be cyclically low than the next two years. The poor planning by the government is making 2019 looking like a recession. If there actually is a recession in 2019, the deficit as a percentage of GDP will be the largest in decades.
