Quick update: How is my NEO swing trading going? Looking at the head & shoulders pattern that has formed....not great!
As the title describes, this is just a quick update on my swing trading attempt with NEO.
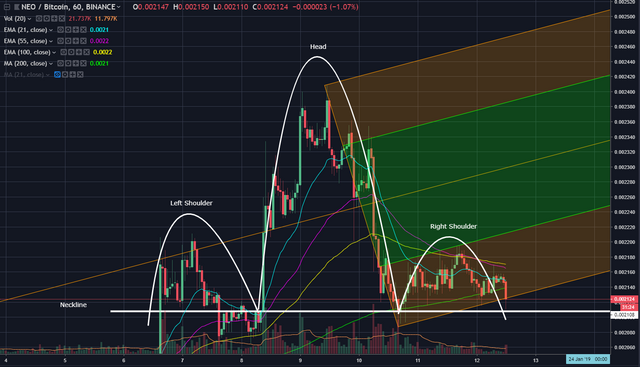
Apart from a dramatic loss of volume which is always worrying, there is clearly a head and shoulders pattern formed on the 1 hour chart which isn't a good sign.
I'm long on NEO which was why I saw this shot at swing trading as relatively low risk, but where do I go from here?
Simple; I'm long on NEO, so I hold. If it drops below 190k satoshis again, I can simply wait because:
- I only ever invest what I can afford to lose
- I still believe that NEO is a good long-term investment and is at it's relative lows
- While I'm waiting, I'll just collect some GAS that I'll also consider part of my trading profit/loss
Below is the 1hr NEO/BTC (Binance) chart with the head and shoulders pattern showing
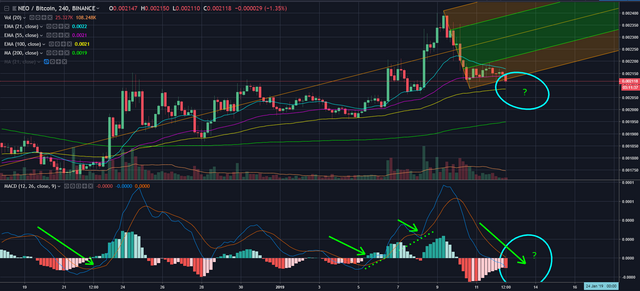
On the 4hr version of that same chart, you'll notice my pitchfork has moved up as the higher highs and lows from that movement were in/complete.
- The light blue ellipses are the points I'm most interested in now
- The yellow 100hour EMA could potentially be a line of support that triggers a bounce up or much deeper losses
- The MACD shows green arrows where crossovers previously led to bullish runs and a green dotted line for bullish divergence.
If we take a hit now but go back to building another indicator like that in the MACD, we could see some volume and bullish sentiment return.
I'm not very interested in other indicators as I feel I have enough idea of movement from just:
- Market structure - has been moving up nicely, but the appearance of head and shoulders is a strong warning signal that we might reverse to bear mode again (although on the 1hr only)
- Volume has dropped and is relatively low again - that makes life difficult and opens the market up to sensitivity/volatility
- 100hour EMA - gives me an idea of support to look for
- 200hour SMA (green) - a potential landing pad if we break the 100hour?
- MACD - actually worth paying attention to this now as even if we go quite low, we aren't looking at bearing divergence (two falling highs), so turning back north might be a sign that we're actually OK
Fingers crossed we can turn this frown upside down!
Disclaimer: This is post only contains my personal views and opinions and is intended as entertainment only. It is not financial advice. You should always do your own research and only invest what you can lose to afford.
Signup HERE to earn some free Bitcoin, whilst the earning is good! (increases payouts when the price is lower)

@onepagex
This post has received a free upvote by @OnePageX
This bot is sponsored by OnePageX.com! To use it, simply reply to your post with @onepagex and you will get an upvote!
OnePageX.com is the simplest cryptocurrency conversion tool online!
@OriginalWorks