Litecoin price analysis: A bottom and long-term targets
An in-depth analysis of Litecoin has been on my to-do list for some time now. This post uses Elliott waves, Fibonacci analysis and indicators to take a look at the long-term evolution of the Litecoin price. It suggests we could see a bottom around 38 USD and that LTC could peak in the range 750–900 USD in the next bull market.
Long-term wavecount
Let’s start with Elliott waves, since this will give us a long-term narrative of price action and provide useful reference points for Fibonacci analysis. The longest-running chart for Litecoin is the Bitfinex chart, which dates back to 2014. Despite the lack of previous data, it’s clear that, like all cryptos, the long-term evolution of Litecoin has been broadly in keeping with the bitcoin cycle. As Chart 2 shows, it suffered the same prolonged correction (red Cycle wave II) in 2014–2015 and also reached an all-time high in December last year (red Cycle wave III). We now appear to be nearing the end of this year’s correction (red Cycle wave IV).
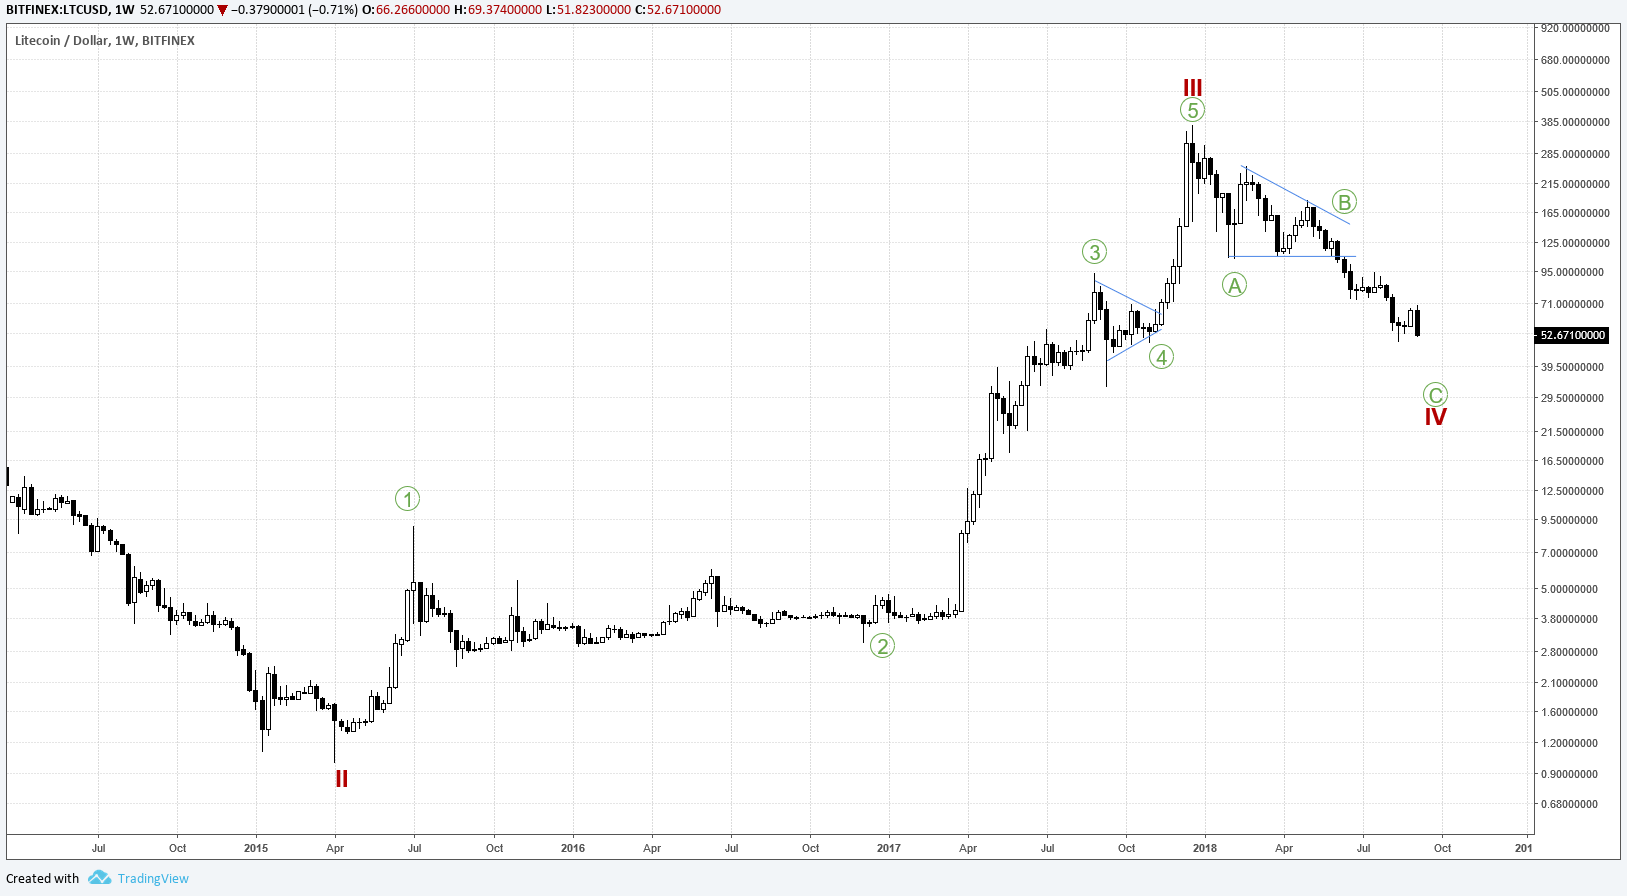
Chart 1. Long-term wavecount for Litecoin. (click to enlarge)
The Primary impulse waves of Cycle wave III are shown in green in Chart 1. Note the triangle that defines green Primary wave 4 (the intermediate waves are marked in greater detail in Chart 2). This suggests a price range of 33–95 USD for the bottom of red Cycle wave IV. (Recall the guideline that wave 4 usually ends in the subrange of wave 4 of the preceding wave 3).

Chart 2. Litecoin 2018 correction. (click to enlarge)
Chart 2 also shows a possible Primary count for Cycle wave IV with a descending barrier triangle for Primary wave B. Note that equality between green Primary waves A and C: if the latter were to repeat the 71.2 percent decline of the former, we would have a bottom of 37 USD. This figure also agrees with the target for the barrier triangle: the height of the triangle represents a drop of 56 percent, which, if projected from the bottom line around 109 USD, gives a target around 48 USD).
Fibonacci
Chart 3 shows a combination of three different Fibonacci techniques: standard retracements, projections and channels. Combining them gives us a grid structure that provides some markers for price.
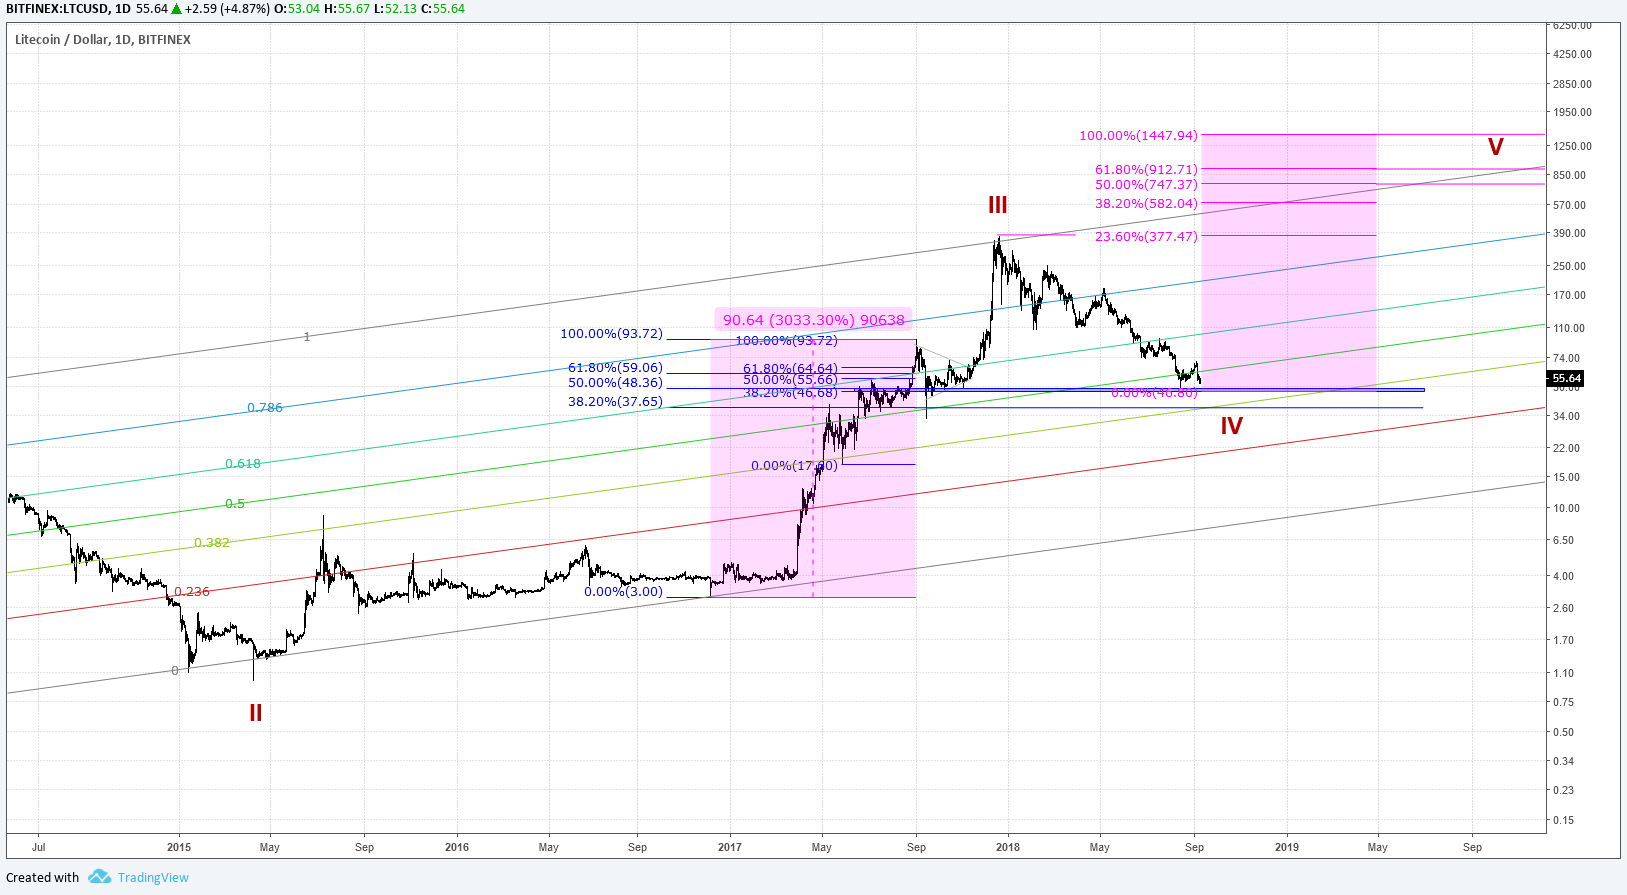
Chart 3. Fibonacci analysis of Litecoin. (click to enlarge)
Firstly, the retracements drawn in blue from the top of the previous Primary wave 3 show support around 38 USD and a confluence zone of strong support at 46–48 USD. (Note both levels coincide with the landing zone identified using Elliott waves.)
Secondly, note that the previous Primary wave 3 saw an increase of around 3,000 percent. Projecting another 3,000 percent rise from the bottom of the confluence zone of 46–48 USD and subdividing into Fibonacci ratios provides some rough markers for possible future highs. (Also note that the 0.236 Fibonacci level of this projection corresponds perfectly with last year’s all-time high.)
Thirdly and finally, Chart 3 shows Fibonacci channels loosely based on the slope between the highs around November 2013 and December 2017 and the lows around April 2015 and December 2016. This gives an idea of correlations between price and time. For example, right now it look slike we will see the confluence of price and time in the Fibonacci resistance around 38 USD and the bottom of the 0.382 channel. It also allows us to set targets based on the duration of Cycle wave V. For example, a bull market that extends throughout 2019 could top out just short of four figures, around 900 USD.
Indicators
Finally, Chart 4 shows the weekly Relative Strength Index (RSI) and Money Flow Index (MFI).
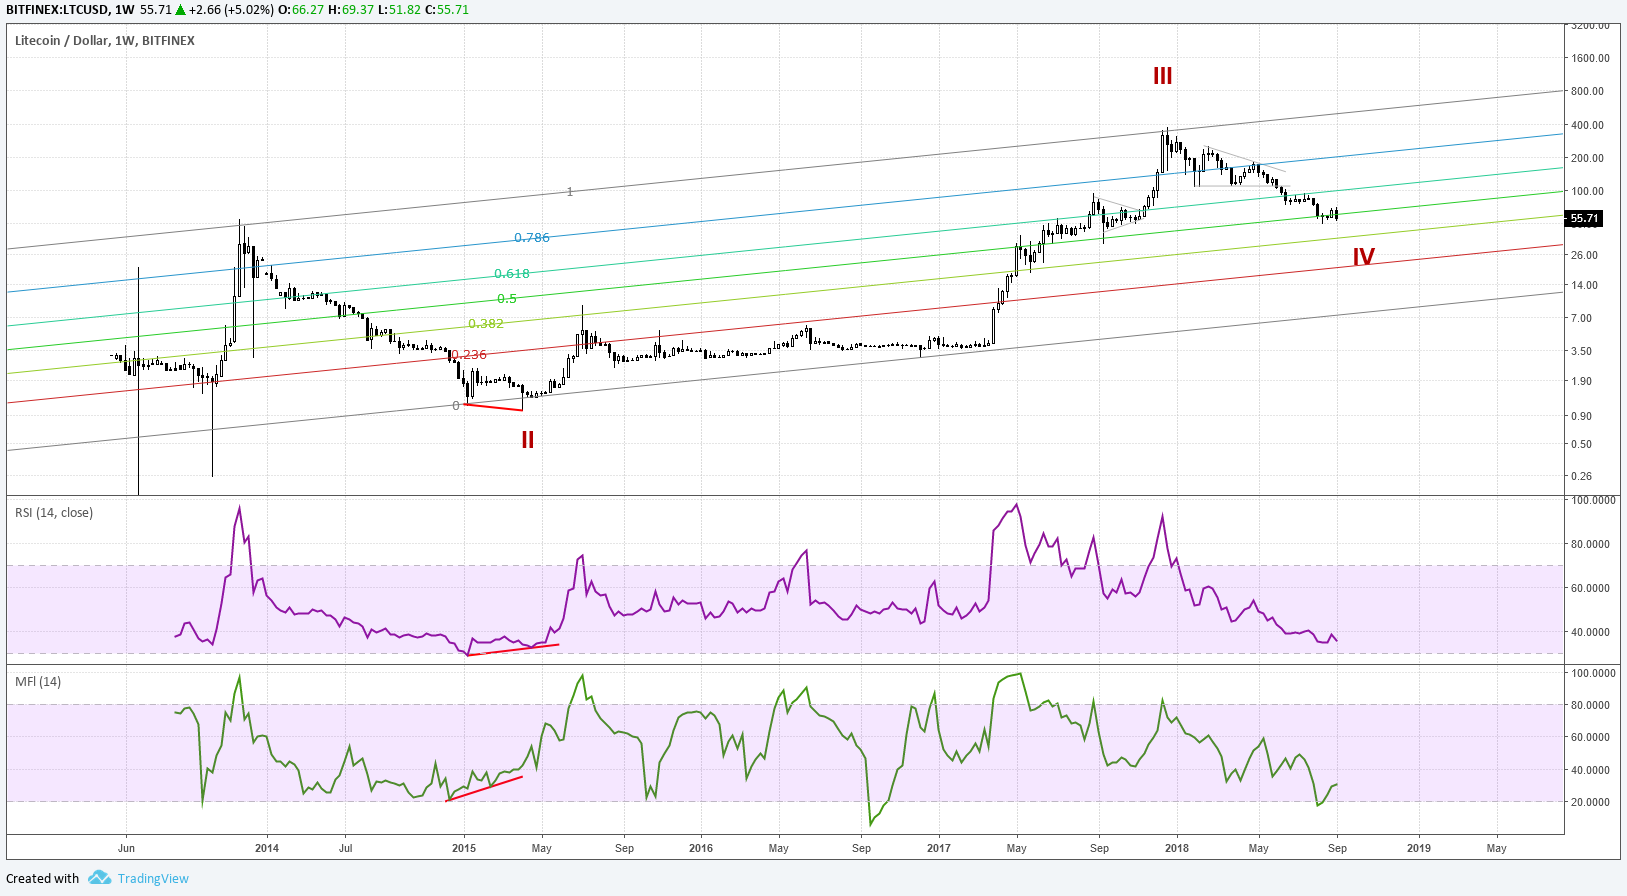
Chart 4. Litecoin weekly chart with RSI and MFI indicators. (click to enlarge)
RSI is currently around 35 and so approaching oversold territory. MFI has already bottomed around 15. Both indicators suggest the end of a long-term downtrend, especially when compared to their behaviour at the end of the last bear market. Last time round, we saw MFI bottom out in December 2014, slightly in advance of the bottom, while RSI bottomed out at the low in January 2015. Significantly, both went on to produce bullish divergence when price bottomed again in April 2015 (marked in red on Chart 4). Could this pattern be about to repeat?
Will the stars align?
All three analysis tools in this post (Elliott waves, Fibonacci and RSI/MFI indicators) suggest grounds for optimism that the bear market is nearing an end. The Cycle degree of trend for Elliott waves suggests we should see a further bull market at Cycle level. Moreover, Fibonacci analysis suggests that, depending on the duration of this bull market, price could peak between 750 and 900 USD.
Disclaimer: I am not a financial adviser. Nothing in this post should be taken as financial advice. All content is provided for information purposes only.
All text copyright @cryptolaidlaw 2018. All rights reserved.
Congratulations @cryptolaidlaw! You have completed the following achievement on the Steem blockchain and have been rewarded with new badge(s) :
Click on the badge to view your Board of Honor.
If you no longer want to receive notifications, reply to this comment with the word
STOPDo not miss the last post from @steemitboard: