Ethereum classic (ETC): a long-term outlook
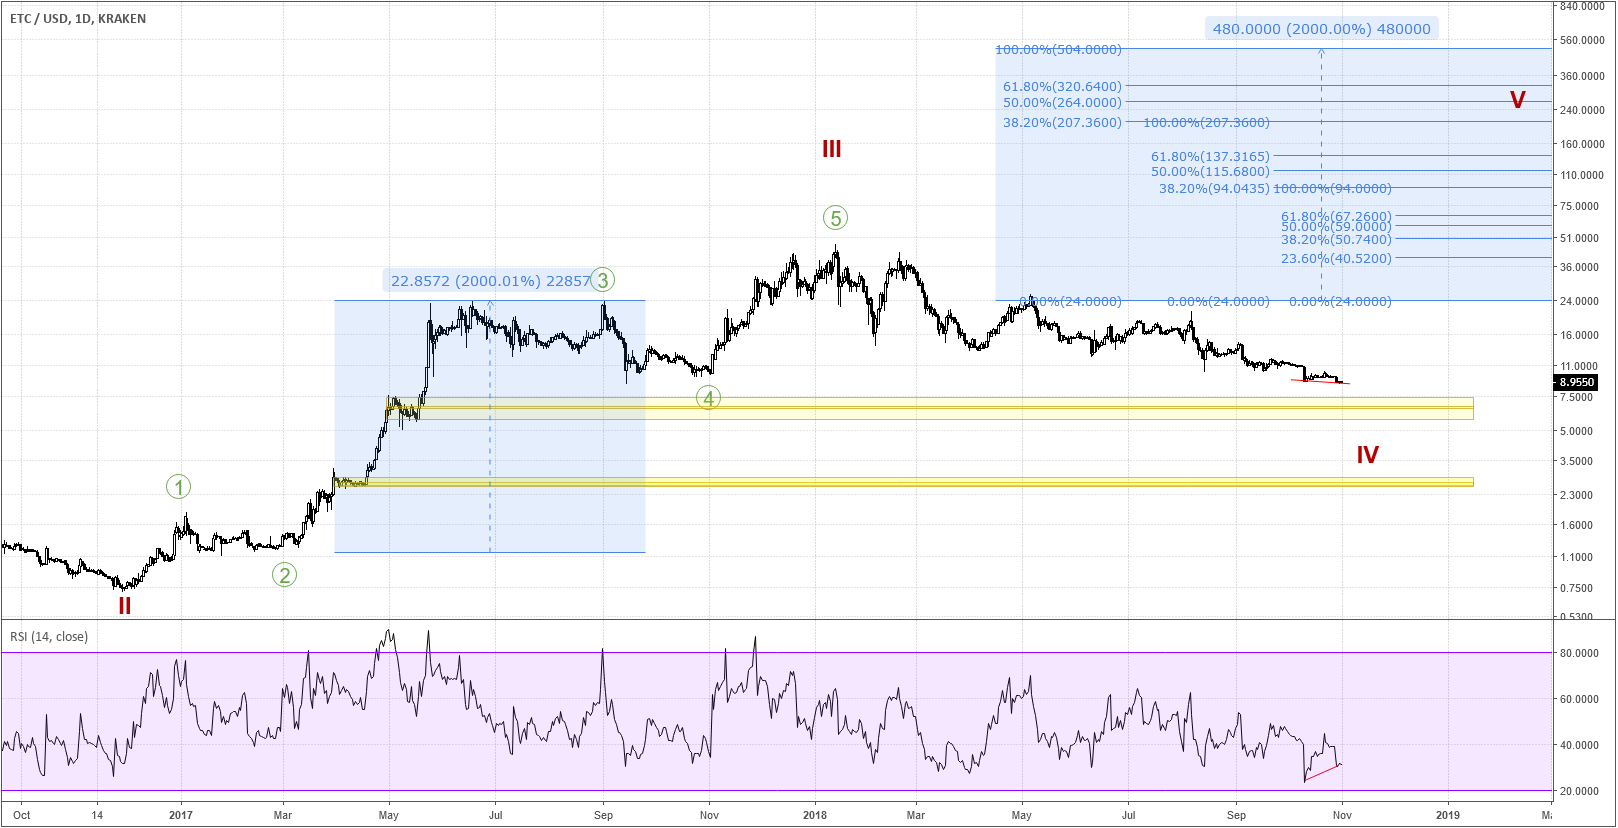 Ethereum classic (ETC) daily chart showing long-term outlook (click to enlarge)
Long-term wavecount
The long-term wavecount for ETC is pretty clear and marked in red on the chart. At cycle level, the top of the first wave (cycle wave I) occurs around USD 2.9 in August 2016, followed by a correction to around USD 0.74 (cycle wave II). There is then a fine example of a third impulse wave (cycle wave III) that takes price to its all-time high of USD 47 in January 2018 before retreating into cycle wave IV. The question, then, is where will wave IV bottom and how high might wave V go.
The normal Elliott guideline is that wave four should end in the region of wave four of the previous degree of trend (primary wave 4 marked in green on the chart). This gives a landing zone of 23.8–8.7 USD. With price currently struggling to hold 9 USD, it really is hanging by a thread. If price breaks this floor, expect a sharp action to the downside. Moreover, while there is some bullish RSI divergence on the daily chart (marked in red), with a period of 20 bars it is relatively weak (zooming in to the 2H time frame, we can actually start to see some bearish divergence).
Support zones
The next major support zone is clearly visible (marked in yellow)on the daily chart at 7.5–5.7 USD, with a band of strong support at 6.5–6.7 USD on the weekly chart. Should this support fail, there is a huge gap down to the next major support zone around 2.5–2.9 USD (again with strong support on the weekly chart around 2.6 USD). In the very worst-case scenario, price could go as low as 1.8 USD before wave failure occurs.
Price targets
Having established the major support zones for the bottom of cycle wave IV, the question arises of what to expect from a hypothetical cycle wave V. The blue box in the top-right of the chart is constructed taking the percentage increase of primary wave 3 (approximately 2,000 percent) and projecting this from the Fibonacci confluence zone at the top of primary wave 3 at around 24 USD. It gives a map of potential resistance points based on the Fibonacci grid determined by primary wave 3 of cycle wave III. Price will encounter significant resistance at 24 USD and 40.5 USD before it’s possible to think about reaching a new all-time high, perhaps targeting 94 USD.
For now, though, the burning question is where does the bottom lie. As is the case with all crypto tokens, everything depends on how bitcoin behaves over the coming weeks.
Disclaimer: I am not a financial adviser. Nothing in this post should be taken as financial advice. All content is provided for information purposes only.
All text and charts copyright @cryptolaidlaw 2018. All rights reserved.