BTCUSD Daily Chart update - June 12, 2018
https://www.tradingview.com/x/Yd7XtyHJ/
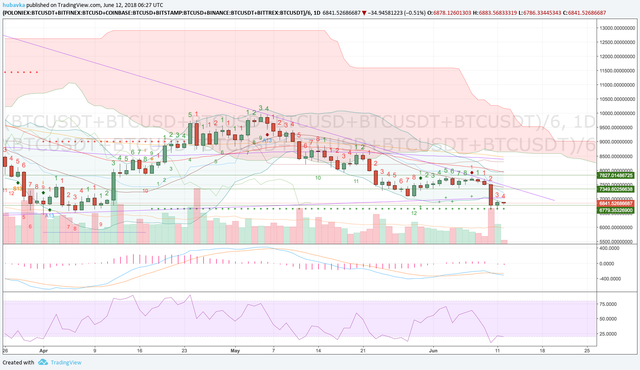
On the last daily update I mentioned that the best opportunity for a trade will be once we break the range $7,350 - $7,800. We broke to the downside for a quick $600. The price stopped at the TD support line as well as the area of the previous lows in April around $6,600. MACD crossed down again after a slow 9 day uptrend. RSI got to oversold quickly. Price went outside of the Daily BB band and trying to get back inside today. After some consolidation we should see another move. On the upside we could bounce up to the $7,100-$7,150 level. On the downside a break bellow the current lows will take us to the $5,900-6,000 level.
Fundamentally I am expecting some kind of news of a big implementation on the BTC network as a catalyst for the new bull market starting sometimes this summer.
Weekly: Down
Daily: Down
4 hour: Up
1 hour: Netural
Prediction for the day
Price will advance to test the $7,100 - $7,150
If you don't have a BitMEX account yet please use this link to register and get 10% off commissions:
https://www.bitmex.com/register/WGhKhX
Signup for the first fully decentralized ALT coin exchange:
https://www.altcoin.io?kid=KAVYG