Blockchain Space as a Commodity: Block Size and Miner Fees as a case of Supply and Demand

(perhaps ledger space would be more accurate, but I think blockchain space has a better ring to it)
Overview
In this post, I will attempt to illustrate that the block size limit of a given coin can have a direct impact on miner fees, specifically when the coin's limit is being consistently hit block-to-block. While this post was made with Bitcoin in mind and has a focus on it as a result, the relationships described within should be applicable to any cryptocurrency that functions in a similar fashion.
Disclaimer: Some of this post's content treads slightly controversial territory, and I do have a slight bias towards Bitcoin Cash based on my experience with both BTC and BCH. I do welcome feedback, criticism, and fact-checking from anyone willing to have rational discussion. Additionally, keep in mind that some of what I broach here may be subject to change, especially relating to statistical record highs.
Basic Mechanics of (most) Mine-able Cryptocurrencies
Below is a basic overview of the general mining system that Bitcoin uses (without the Lightning Network or SegWit). Most cryptocurrencies implement some or all protocols of the following description in one form or another, but many have further complexities or completely different structures, especially those which function as cloud computing platforms (e.g. Ethereum, NEM, and many others). If you are familiar with the inner workings of Bitcoin-type currencies, as I'd wager many readers here are, the rest of this section is probably not necessary to read, but feel free to go through and proofread it just in case I made any mistakes. Additionally, please let me know if you are new and there's something that doesn't quite make sense or could be expanded upon.
In order to send money from one account to another in many current top cryptocurrencies (namely with Bitcoin), a transaction must be verified, then placed into a digital "block" of data and cryptographically linked into the blockchain's ledger by miners in order to be considered valid. In order for a block to be linked, it needs a proper hash, which is essentially a number that mathematically represents the block. Because it takes a lot of computational work to find one valid hash out of an incredibly high number of possible candidates, miners who find the correct hash for a pending block are compensated with 1) the block reward, determined by the block's sequence number (or height) in the chain, and 2) miner fees offered by accounts sending money. Many cryptocurrencies are set up this way to incentivize mining, which in theory leads to a coin being more secure and decentralized by virtue of the incentives being appealing to just about anyone seeking a profit.
Prior to a transaction being worked into a block, it is placed into a pool of memory (or mempool) that is shared between nodes on a coin's network. The transactions in this pool have not yet been confirmed, and from it miners can choose what payment data to include in a given block before attempting to find the correct hash for it. Through this process, it is possible to produce a valid hash for a block containing any information (even fraudulent data fabricated by the miner, but other nodes can verify the legitimacy of transaction entries and reject bad blocks. Because of this, producing fake transactions is largely a waste of time). Bitcoin's difficulty level is dynamically set such that it takes around ten minutes for a block to be found, automatically adjusting itself based on the total computing power of miners on the network. After a valid hash is computed for a block that a miner has been working on, the block is then broadcasted to the network to be verified and subsequently cemented into its position on the coin's blockchain (assuming nobody else found a different, but also valid block first).
Based on the transactions that a block contains, a given block can end up taking more or less data in the blockchain once/if it gets confirmed by other miners. Many cryptocurrencies have a block size limit, typically to reduce spam. Any broadcasted block that contains more data than the limit is rejected by the network.
Supply and Demand

One typically has more control over the supply, but demand can be influenced via marketing.
Anyone who's taken a basic Economics class should be familiar with the concept of supply and demand. In a nutshell, it's the observation that the price of a product is determined by how badly people want to purchase it, and that a product's supply affects its price based on how much it fulfills demand. In a market with competition, high demand with low supply equates to a higher price, and a low demand with high supply translates into nobody willing to pay as much. The concept sees a lot of application in the business world, where the goal of most companies is to discover the point at which the supply and demand are equal to each other. At this equilibrium point, the maximum amount of product can be created to satisfy the demand without any wasted extra being produced, thus maximizing sales numbers.
While Bitcoin itself isn't necessarily a business, it does exist in a competitive market. Though it has had the advantage of being a trailblazer in the world of cryptocurrency and still boasts currently unparalleled mainstream recognition, it will eventually give way to competing coins if any of them manage to do a sufficiently better job than Bitcoin at its exact purpose: to be a secure, decentralized, and easily transferable digital asset.
Differing Approaches to the Problem
For a while now, Bitcoin has had a considerable problem: its capped processing rate is throttling transaction throughput. The 1MB block limit was originally written into Bitcoin's source code by Satoshi Nakamoto (the coin's founder) to prevent the network from being spammed with bloat when the cryptocurrency was in its infancy stages, when it would have been cheap for an attacker to place obscenely large amounts of data onto the blockchain (since Bitcoin miner fees are calculated in Bitcoin based on the amount of data a transaction contains). The primary reason for the Bitcoin Cash fork in August 2017 was over a disagreement between the community on what should be done about the block size limit. As a result, BCH and BTC now have different approaches to increasing transaction throughput, each with their trade-offs.
The approach of Bitcoin's Core developers is to use several different technologies on top of the main Bitcoin blockchain, namely Segregated Witness (SegWit) and the Lightning Network (LN), which attempt to offload transactions from the main blockchain by utilizing side-chains and several other protocols. Bitcoin Cash's approach is to increase the block size limit as it becomes necessary, having most recently brought it from 1MB to 8MB in the coin's initial hardfork. The key difference between the two is that BCH's solution is on-chain and BTC's solutions are off-chain, but the aim of both is to improve the payment processing rate.
Throttled Throughput, High Fees
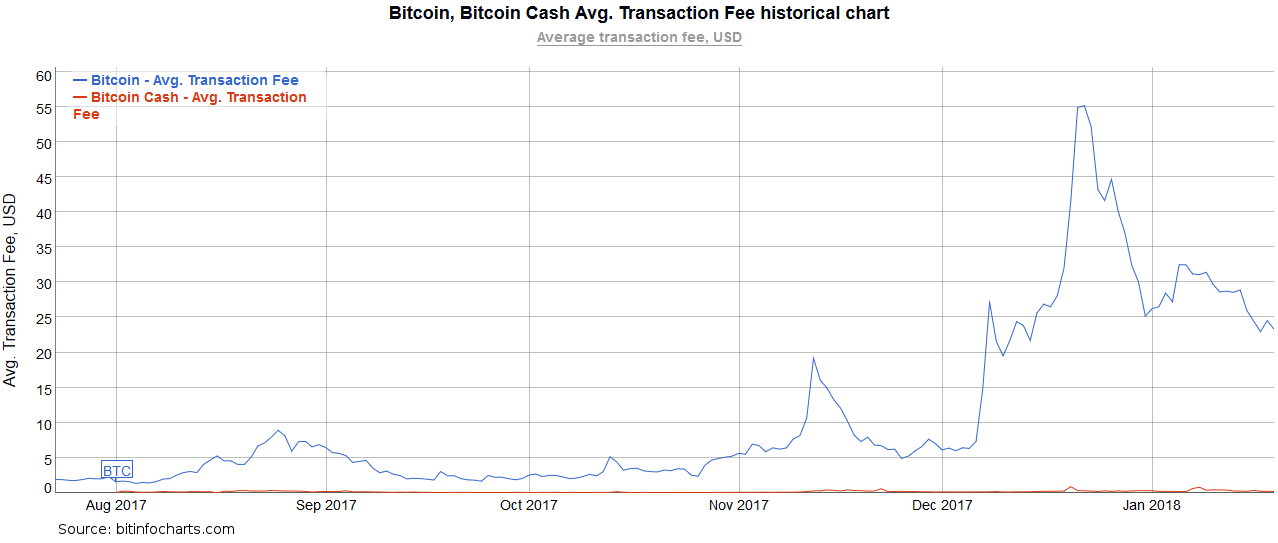
A linear comparison between the miner fees of Bitcoin and Bitcoin Cash.
It's no secret that Bitcoin (BTC) has had a rough ride with its transaction fees over the past few months. At its worst, average fees for on-chain BTC transactions topped at over $55, which suffice to say was unreasonable for day-to-day use. Bitcoin Cash (BCH) has not had such issues with its own miner fees, but it also bears noting that the coin has had nowhere near the overall traffic of BTC itself, as is illustrated by the graph below displaying the average block size:
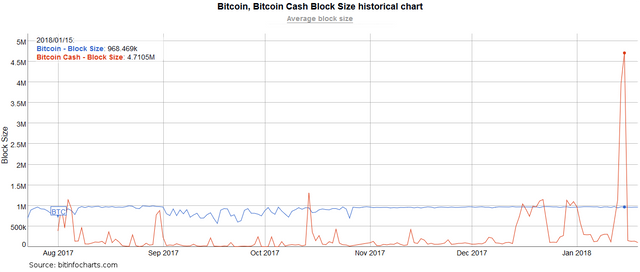
A linear comparison between the average block sizes produced by Bitcoin and Bitcoin Cash.
As you can see, BCH has a much lower overall throughput, albeit having several spikes with blocks over 1MB, but BTC has mostly hovered right at the ceiling of its block limit. When the limit is hit, it indicates that not all transactions could be processed in that block, so the remaining ones are kept in the mempool until there's enough space in a later block. The problem is that such a block may never present itself. If a transaction includes a lower miner fee than another one, it is treated with lower priority, and it may potentially never get processed. If the network stays congested for long enough, the oldest data (i.e. the lowest-priority transactions) will eventually get purged from the pool without being processed.
This phenomenon has been happening at nearly every Bitcoin block for months now, and has resulted in the coin's blockchain space becoming a commodity with a significantly higher demand than supply (and thus, a higher price). If hitting the limit occurred just a handful of times, it would not be too big of an issue, but the fact that it has been happening block after block indicates that BTC has been having major scaling issues.
As I will delve into in the next section, there is a strong relationship between the demand for Bitcoin transactions and the average transaction fee, especially with the demand as high as it's been along with the processing speed/supply limited to roughly ~1.71 kB per second (derived by dividing the 1024 kilobytes in a megabyte by the 10 minutes per block and further by the 60 seconds per minute).
Statistical Analysis on Mempool Sizes vs. Transaction Fees
This may not be the most in-depth analysis, but I found an interesting correlation between the average transaction fees and the mempool sizes on the Bitcoin Core blockchain. While it becomes somewhat more chaotic in December along with the surge in mainstream exposure that the cryptocurrency community received, nearly all peaks in transaction fees prior to that time period correspond with peaks in mempool size as well.
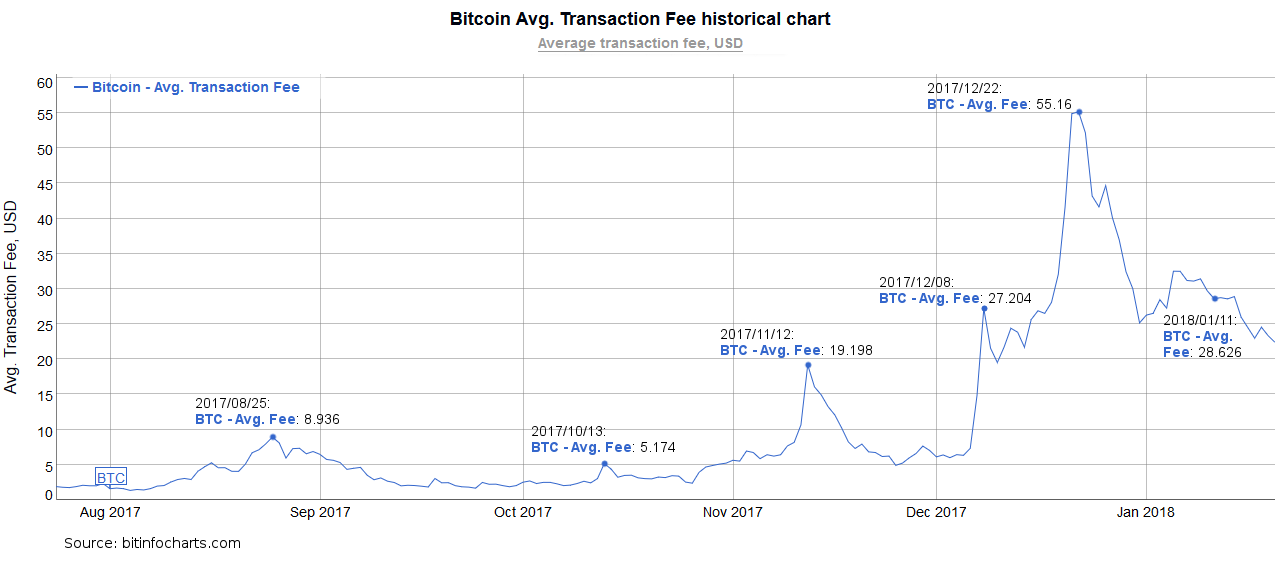
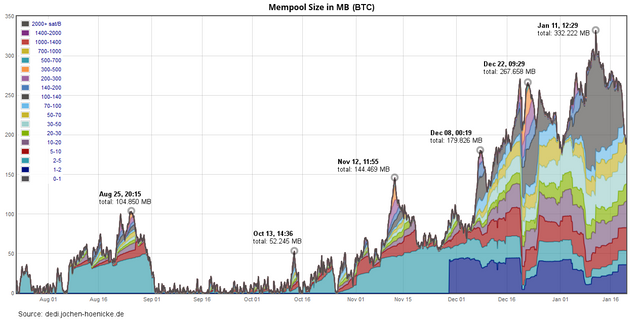
A few of the spikes near the end don't match up as well, but I would argue that it's still pretty indicative of the situation overall.
It stands to reason that the mempool size must increase before the miner fees, since transactions must be broadcasted and placed into the mempool before being verified and locked in. As the network becomes more and more congested with competing transactions, miners almost always select entries with the highest fees first, requiring users to pay more if they want their payments processed in a relatively timely manner. To recap, when the block size limit is reached, an increased demand leads to a proportionately lower supply of ledger entries, which subsequently results in a higher cost to secure a spot.
For the sake of even-handedness, and to show the same data from both of the coins I've been taking a look at, here are the statistics on Bitcoin Cash's mempool since the coin's initialization in August:
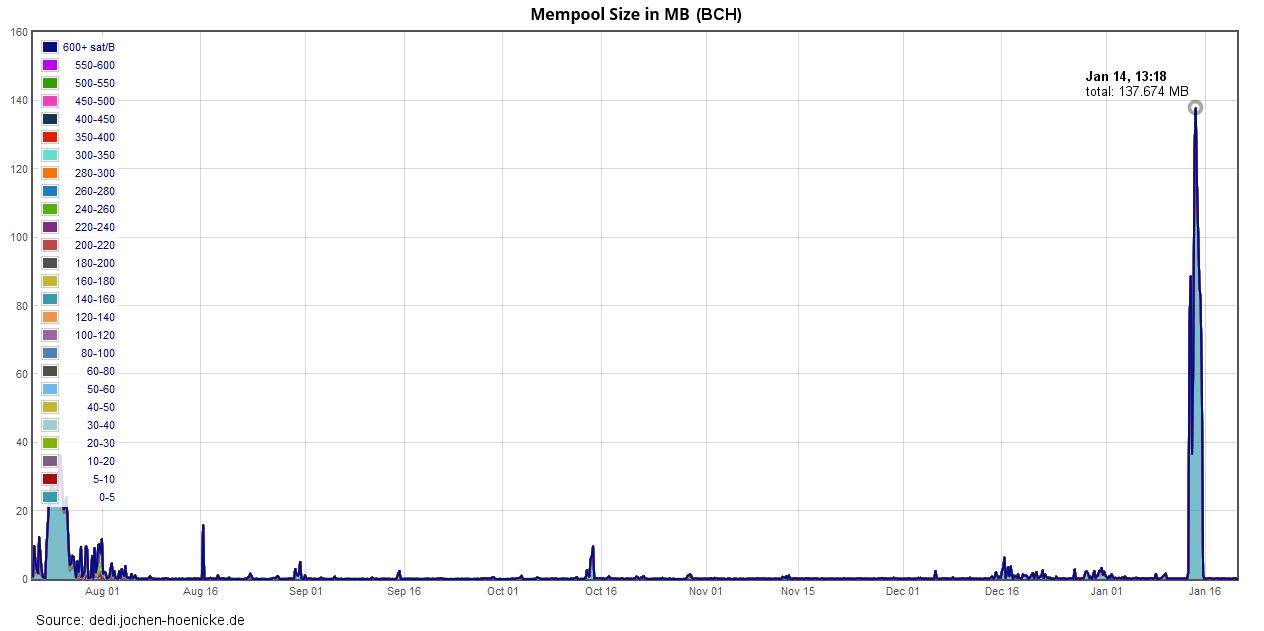
If you compare the above graph with the charts in the "Supply and Demand" section, you will see that the spike in the BCH network's mempool corresponds to the large (4MB+) blocks that were created, and the fees still stayed low thanks to the ample supply of block space. While the mempool definitely spiked, it was quickly worked through and processed by the network.
Inconsistent SegWit data and limited LN information
Disclaimer: I may have just been looking in the wrong places for this data, but this information is all I could find after several hours of searching.
One thing that I find curious is the mempool and fee activity occurring after about mid December. I thought that it might be related to a wider adoption of SegWit, but the data I've found don't seem to indicate as such. (Unrelated Sidenote: I still think it sounds wrong to grammatically treat the word data as a plural noun, but apparently that's how it's supposed to work.)
Here are some graphs I've found on SegWit adoption I've found from three different sources:
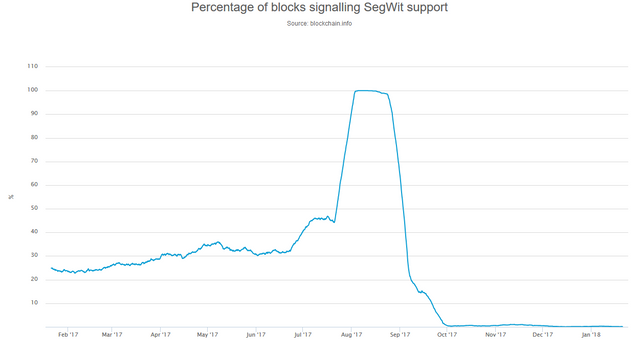
According to this graph, it looks like the biggest increase of adoption was actually in August, likely due to the BIP 9 SegWit lock-in. It looks like this graph's data is specifically tracking blocks tagged with BIP 9 metadata, as evidenced by the URL of the chart's webpage.
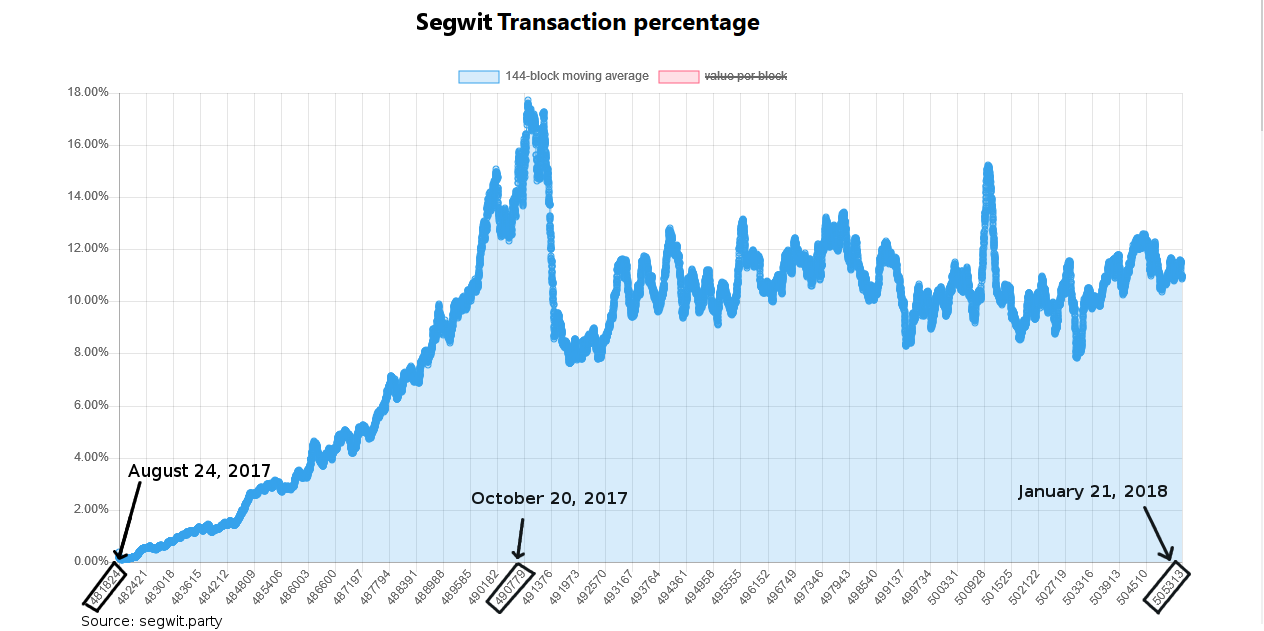
The differing data could also have to do with differing presentation methods, with the rolling averages of this graph versus the raw data of the other two.
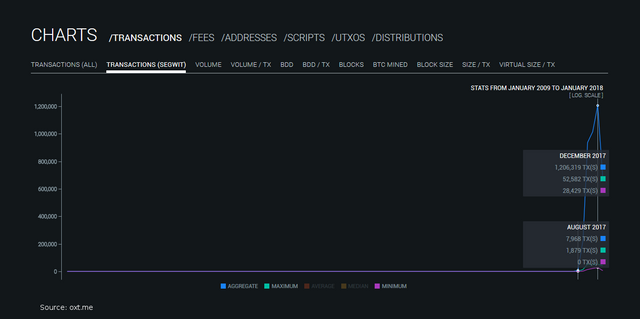
I apologize on this last one, but I couldn't find an option to view this dataset in a more focused time frame. At any rate, this graph displays the highest adoption as having occurred in December, which is somewhat puzzling in the context of the other charts.
Another factor to consider is nodes making use of the Lightning Network. Based on my current understanding, it is not publicly broadcasted whether or not a transaction is from an LN node, meaning that information on LN adoption is at least somewhat speculative. Further research may be necessary to come to a stronger conclusion on the matter, as I don't think I've yet ruled it out as a possibility.
In Summary/Reflection
Phew, there was a bit more to dig through that I initially expected, especially pertaining to the seemingly convoluted and/or non-existent data involving SegWit and LN. I hope that my more basic explanations didn't pull the post too off topic, but always try to make my submissions at least relatively approachable to a general audience. Again, if you're one of those people, and something here didn't make sense or doesn't quite click, please say so and I'm sure that the community will provide an explanation or helpful link if I don't get to you in time (or don't know the answer).
From what was covered in this article (if you would call it that), it should be clear that a limited block size can lead to network congestion and high fees if said block limit is consistently being hit. The reasoning for this phenomenon can be explained as a simple case of Supply and Demand, given that space in the ledger becomes proportionately low in supply during times of high traffic.
Please let me know if anything in my post could be reworked or improved upon, or if you've found something interesting in the data that I've missed.
Sources
Assets:
- "Blockchain Space as a Commodity" asset by me, Bitcoin logo pulled from Bitcoin.org and slightly modified by me as well
- "Supply and Demand" diagram also created by myself
Data:
- BTC/BCH transaction fee graph: https://bitinfocharts.com/comparison/transactionfees-btc-bch.html#6m
- BTC/BCH block size graph: https://bitinfocharts.com/comparison/size-btc-bch.html#6m
- BTC mempool statistics: https://dedi.jochen-hoenicke.de/queue/#6m
- BCH mempool statistics: https://dedi.jochen-hoenicke.de/queue/#6m
- SegWit Adoption graph #1: https://blockchain.info/charts/bip-9-segwit
- SegWit Adoption graph #2: http://segwit.party/charts/
- SegWit Adoption graph #3: https://oxt.me/charts
NOTE: Statistics pages may appear differently if viewed significantly later than January 20th, 2018. Snapshots of 6-month histories were taken on that date, so you will probably want to set the time frames from July or August 2017 to January 2018 if you want to dig through the same data.
Thank you for reading, and I look forward to your replies. :)
Coins mentioned in post: