XRP Price Analysis July 18th, 2019
At Cryptotreat, we offer regular price analyses of XRP and other cryptocurrencies. Today July 18 we are beginning a new series price analyses for top cryptocurrencies including XRP.
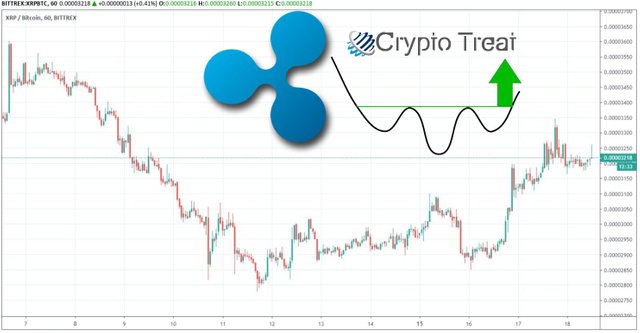
On July 6, 2019, the XRP price reached a high of 3600 satoshis. A decrease ensued. On July 11, it reached a low of 2777 satoshis. Since then, it has been increasing.

Will XRP again reach highs above 3600 satoshis? Keep reading below in order to find out the answer.
XRP Price: Trends and Highlights for July 18
- XRP/BTC broke out from a descending resistance line.
- There is bullish divergence developing in the RSI and the MACD.
- Daily moving averages are starting to turn positive.
- There is resistance near 4000 satoshis.
Previous XRP Price Movement
On June 6, the XRP price reached a high above 5400 satoshis.It has been decreasing since, following the descending resistance line outlined below.

On July 16, the XRP price broke out above this line.
However, the breakout occurred with minimal volume — reducing its validity.
In these cases, it is customary for the price to initially drop towards the resistance line before resuming its upward movement.

This view is also supported by the fact that after the breakdown, the XRP price failed to increase above the previous support area which has now turned to resistance.
Therefore, we would expect the price to decrease in the short-term before resuming its uptrend.
Let’s take a look at some technical indicators to see if they confirm our hypothesis.
Technical Indicators

The fact that it is present in both indicators further increases its significance.
Additionally, it is also present in the daily time-frame — albeit it is much less significant.
A look at daily moving averages (MA) shows that the XRP price has taken its first steps in confirming the uptrend.

The next day, the rally was stopped once the price reached the 20-day one.
At the time of writing, it still has not moved above it.
However, the 10-day MA has started to turn upward, possibly setting itself up for a bullish cross.
Even though the breakout transpired with minimal volume, a look at momentum indicators and MAs make us believe that the breakout was legitimate.
Therefore, we would expect the price to eventually confirm the uptrend and continue increasing.
If it does, where will it find resistance?
Potential XRP Price Movement
If the XRP price continues to increase, two resistance areas are outlined below:

The first one is found at 3300 satoshis, where the XRP price is currently trading.
The second one is found near 4000 satoshis. We believe that it is likely that the price will eventually reach this area.
Also, since it is possibly creating an ascending support line, a rough outline of its possible future movements is shown above.
Summary
The XRP price recently broke out from a descending resistance line.
According to our analysis, it is likely that it will reach the resistance area outlined above.
Do you think XRP will reach one of the resistance areas outlined above? Let us know in the comments below.
Disclaimer: This article is not trading advice and should not be construed as such. Always consult a trained financial professional before investing in cryptocurrencies, as the market is particularly volatile.
Images are courtesy of Shutterstock, TradingView.
Posted from Cryptotreat Cryptotreat : https://cryptotreat.com/xrp-price-analysis-july-18th-2019/