XRP Price Analysis – April 26 Bearish
XRPUSD Medium-term Trend: Bearish
- Resistance Levels: $0.56, $0.58, $ 0.60
- Support Levels: $0.29, $0.27, $0.25
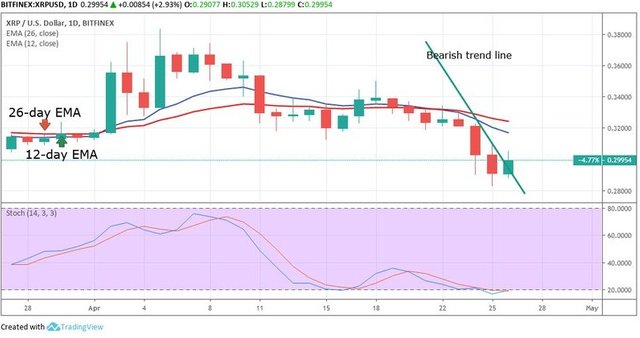
XRP’s price could, as a result, rise to $0.3, while on the other hand if the bulls face resistance over the trend line, the crypto’s price could fall back to $0.28. The Stochastic indicator is in the oversold region, around range 20. This shows XRP is in bullish momentum and is a buy signal.
XRPUSD Short-term Trend: Bullish

XRP Chart by TradingView
On the 1-hour chart, the price of XRP is in a bearish trend. On April 25, its price fell to a low of $ 0.29045, and it was then assumed it would keep on dropping to $0.28. The $0.29 support, however, managed to hold the bears back until the trend was broken.
While the bearish trend line has been broken, XRP’s price being below its EMAs indicates we’re not in the clear just yet. If these indicators are broken we can expect to see the crypto move to $0.30, $0.31, or even $0.32. Its Stochastic Oscillators are in the overbought region over 60, indicating bullish momentum.
Posted from Cryptotreat Cryptotreat : https://cryptotreat.com/xrp-price-analysis-april-26-bearish/