When To Buy Bitcoin?
Introduction
Before we get started, let's talk about some assumptions. I assume that you, the reader, are interested in bitcoin, and you understand the risk. This is a new technology and anything could happen (very good, or very bad). If you have decided to invest in bitcoin, and you are looking for an entry point, then you want to make the best decision possible. This is where I come in.
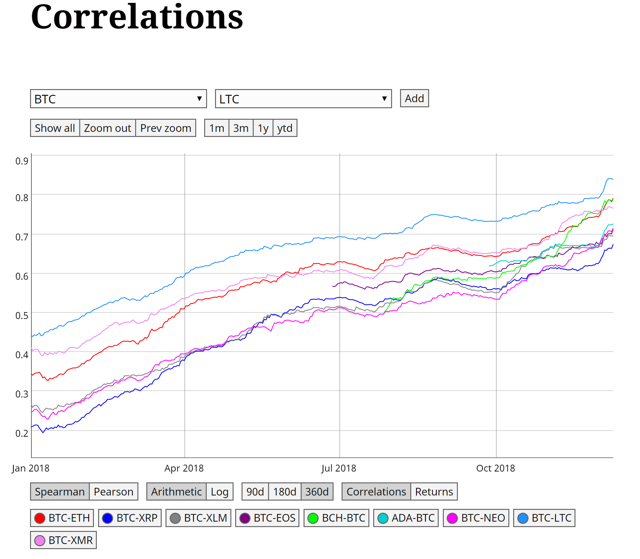
If you are investing in cryptoassets, you need to be aware of what's going on with bitcoin. This is because bitcoin is the largest cryptoasset right now, and we have seen high levels of correlation in the cryptoasset markets (specifically among top cryptocurrencies). This year these levels have increased as the crypto winter wears on, like animals huddling together for warmth in the winter.
Source: coinmetrics.io So, if you want to invest in cryptoassets, it's very important to understand what's going on with bitcoin. As a rule of thumb (yes, there are many many exceptions here), when it's a good time to buy bitcoin, it might also be a good time to buy others too, like Ethereum , Ripple, or Litecoin. Let's get started.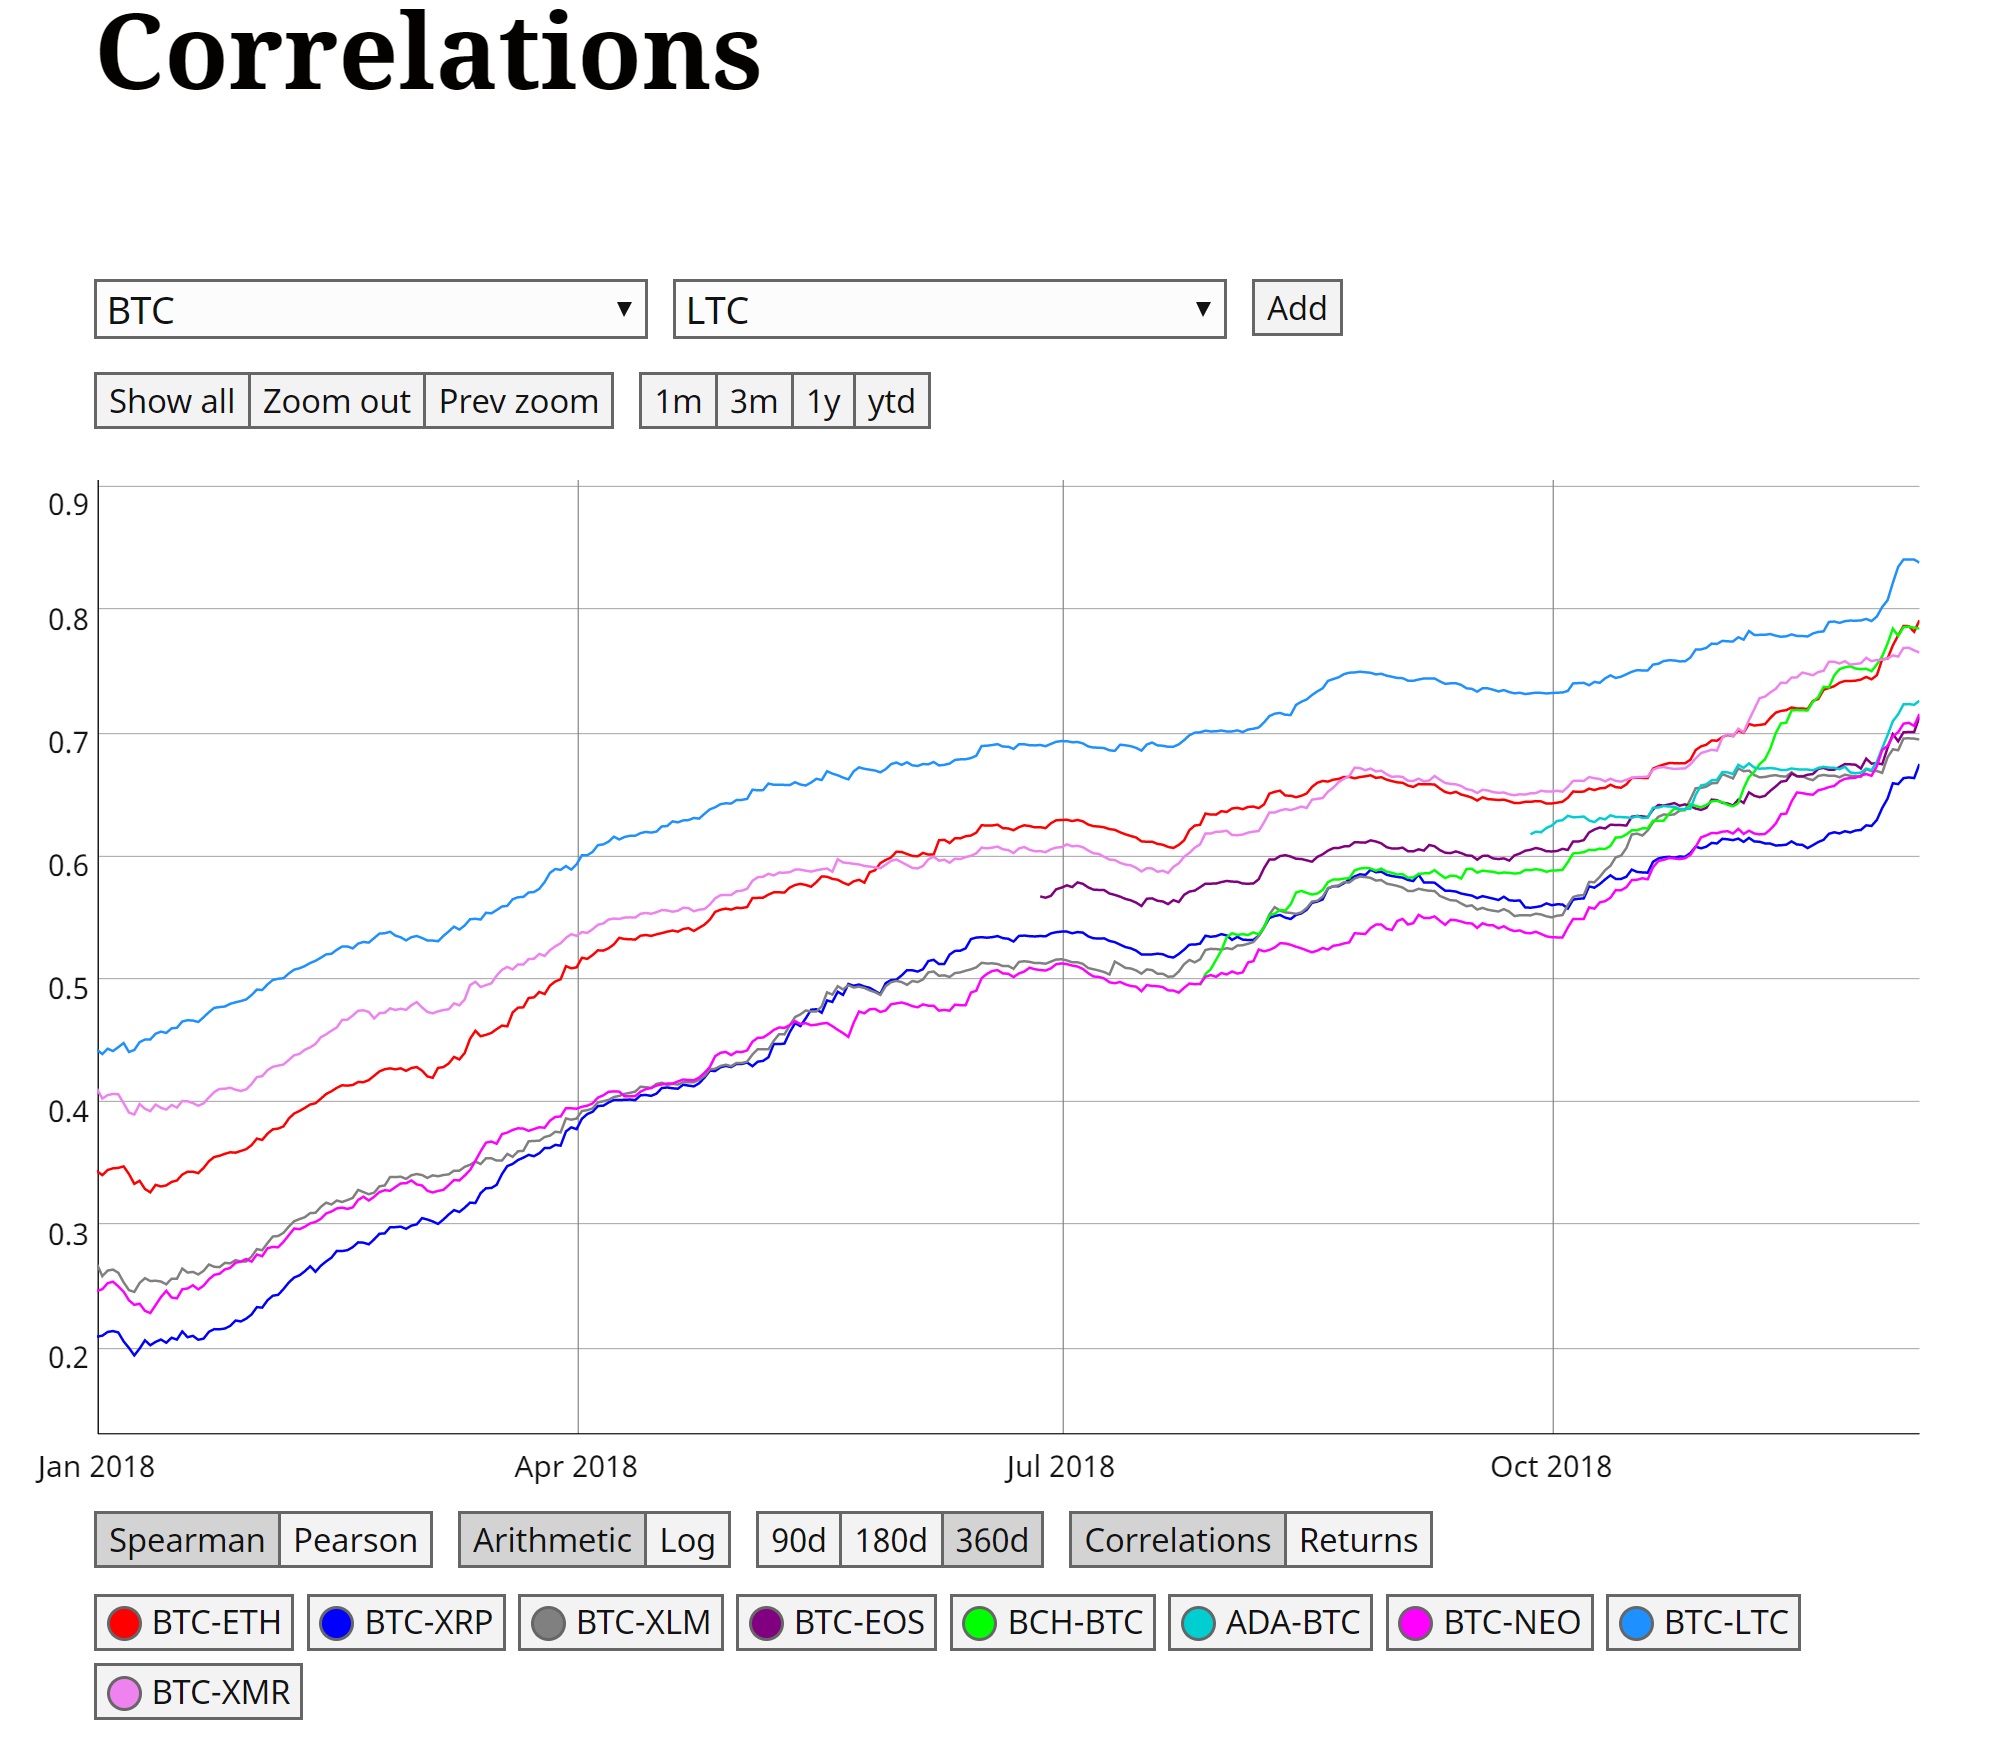
Fear
Fear is a human emotion, and thus hard to quantify for most of us. Unless you happen to be a psychologist with the entire world wired up to some advanced machinery measuring their biometrics, how do we know when people are fearful, and to what extent?
I'm going to go over two of these ways today, and you should know that these are imperfect methods. However, they are not insignificant and I think they're better than having no indication at all. Please use this data as one part of your decision-making process, and not as a replacement for other research.
The Futures Curve
Because bitcoin now has several futures markets, we can gauge market sentiment by the delta between the price right now and the price people expect in the future. See below:
Source: Austeritysucks.com How about that domain name? As you can see, expectations for bitcoin's price in the near future are trending downward. The Crypto Fear/Greed Index The Crypto Fear/Greed index takes in multiple data sources. Some of these sources are volatility, social media, surveys, and more. Source: alternative.me You can also see this over data projected over time. I have written extensively on the difference between the value of the bitcoin network and its price. The ability to understand this delta is the key to making money by investing in bitcoin. Buy when the price is low but the value is high, sell when the price has greatly exceeded the value. Recall that the value of the bitcoin network can be quantified in several ways. The most obvious way is just to look at the performance of the network, the number of participants, and the activity levels of those participants. Now, at the beginning of this year, the bitcoin network was struggling to handle the volume of transactions. Fees spiked up, and people were practically forced out of the market. But, bitcoin is constantly improving. See below: Source: coinmetrics.io In January of 2018, the bitcoin network processed around 250k transactions in a single day. However, if you wanted your transaction to be included in that batch, you had to pay a very high fee due to network congestion. In fact, the average fee back then was $10-20. Today, we're processing that same number of transactions for about $0.42. You might be thinking, "wait, bitcoin's price went down, that's why the fees are lower." But, that's not the reason. To verify this, we can look at the fees paid in terms of BTC. Source: blockchain.com The reason the network is performing so much smoother is because SegWit adoption has increased by a factor of five since January. Source: p2sh.info When a network upgrade is released, it takes time for the benefit to be felt by the users. This is because there's work involved in updating software to support this new tech. But, as more and more wallets, businesses, exchanges, etc include this new upgrade, we see the benefit trickle down to the users (in the form of more TX throughput and lower fees). The next wave will meet a network with higher throughput capabilities and new technology is coming in hot right behind that. Source: p2sh.info Price Of course you know the price of all cryptoassets has been slaughtered this year. But, this is the exact thing you're looking for, isn't it? Increased performance at a massive discount. There are numerous bitcoin price signals and indicators. I've reviewed many of these and found a few diamonds in the rough. Today, I want to talk about just three of these. I think it's interesting that using completely different methodology, they are basically singing the same tune. The Mayer Multiple The Mayer Multiple is the most simple indicator; an oldie but a goodie. The bitcoin price is divided by the 200 DMA, and that's it. Source: theinvestorspodcast.com The idea is to purchase bitcoin when this ratio is low. This indicates a divergence from the trend to the low side. The same is true for spotting bubbles but in reverse. When the ratio is high, the price has far exceeded the 200 DMA trend, and we might be in dangerous territory. The Mayer Multiple is low, but perhaps not at the bottom yet. NVT Ratio I reviewed the NVT ratio. My only beef with it was that it tended to lag the market at the top and the bottom. However, there's more data that we can pull out of this approach. The NVT ratio is just the bitcoin market cap divided by the daily USD trade volume (on chain, not exchange volume). Let's take a look. Source: charts.woobull.com In the past, I focused on the thick red line, which is the actual ratio determined by a rolling average. However, the thin grey lines are the daily values which make up the rolling average. Look how low they've dipped recently. Notice how the thick red line has been in a nosedive the last few weeks? The idea behind NVT is to buy between the two dotted lines, in general as low as possible. Big spikes above those dotted lines are a big warning signal that you might be in a bubble. Recent action in NVT suggests that we're quickly entering the buy zone, but we may still have more downward pressure in the near term. The Bitcoin Z-Signal The Bitcoin Z-Signal is my latest experiment in bitcoin price modeling. I take in the daily transactions, total count of all transactions (the running total), and the number of unique addresses in use. I transform these into log scale, and run multiple regression against the price, also in log scale. Source: blockchain.com and author's charts On the left y-axis is the bitcoin price. On the right y-axis is the standardized output of the price/predicted by the model. This is the Z-score. The floor is a Z-score of about -0.5, and the ceiling is theoretically infinity. See that little blip of blue just poking its head below zero? Looking at the Bitcoin Z-Signal, we have been in crypto winter mode since the end of 2017. However, only very recently have we started to register values that are below the prediction. The best time to buy is when the price is far below the prediction, and the best time to sell is when the price is far over the prediction. The Z-Signal seems to indicate that we are now entering optimal buying territory, even if we are not yet at the absolute bottom of the market. I have shown that right now, people are fearful. Also, the network is capable of handling much more volume for a lower fee, indicating that increased demand can now be met. Additionally, three popular pricing models show that the ideal time to buy is rapidly approaching, even though we probably have yet to see the absolute price floor of this market cycle. By the way, to me bitcoin and cryptoassets are about more than just making money through investing in some "get rich quick" scheme. I see a future that will rely on cryptographic systems that are decentralized to protect our basic human rights. If you would like to know more, see here for a discussion that goes beyond investing. Cheers, This article was published first in Crypto Blue Chips, my private investing community. 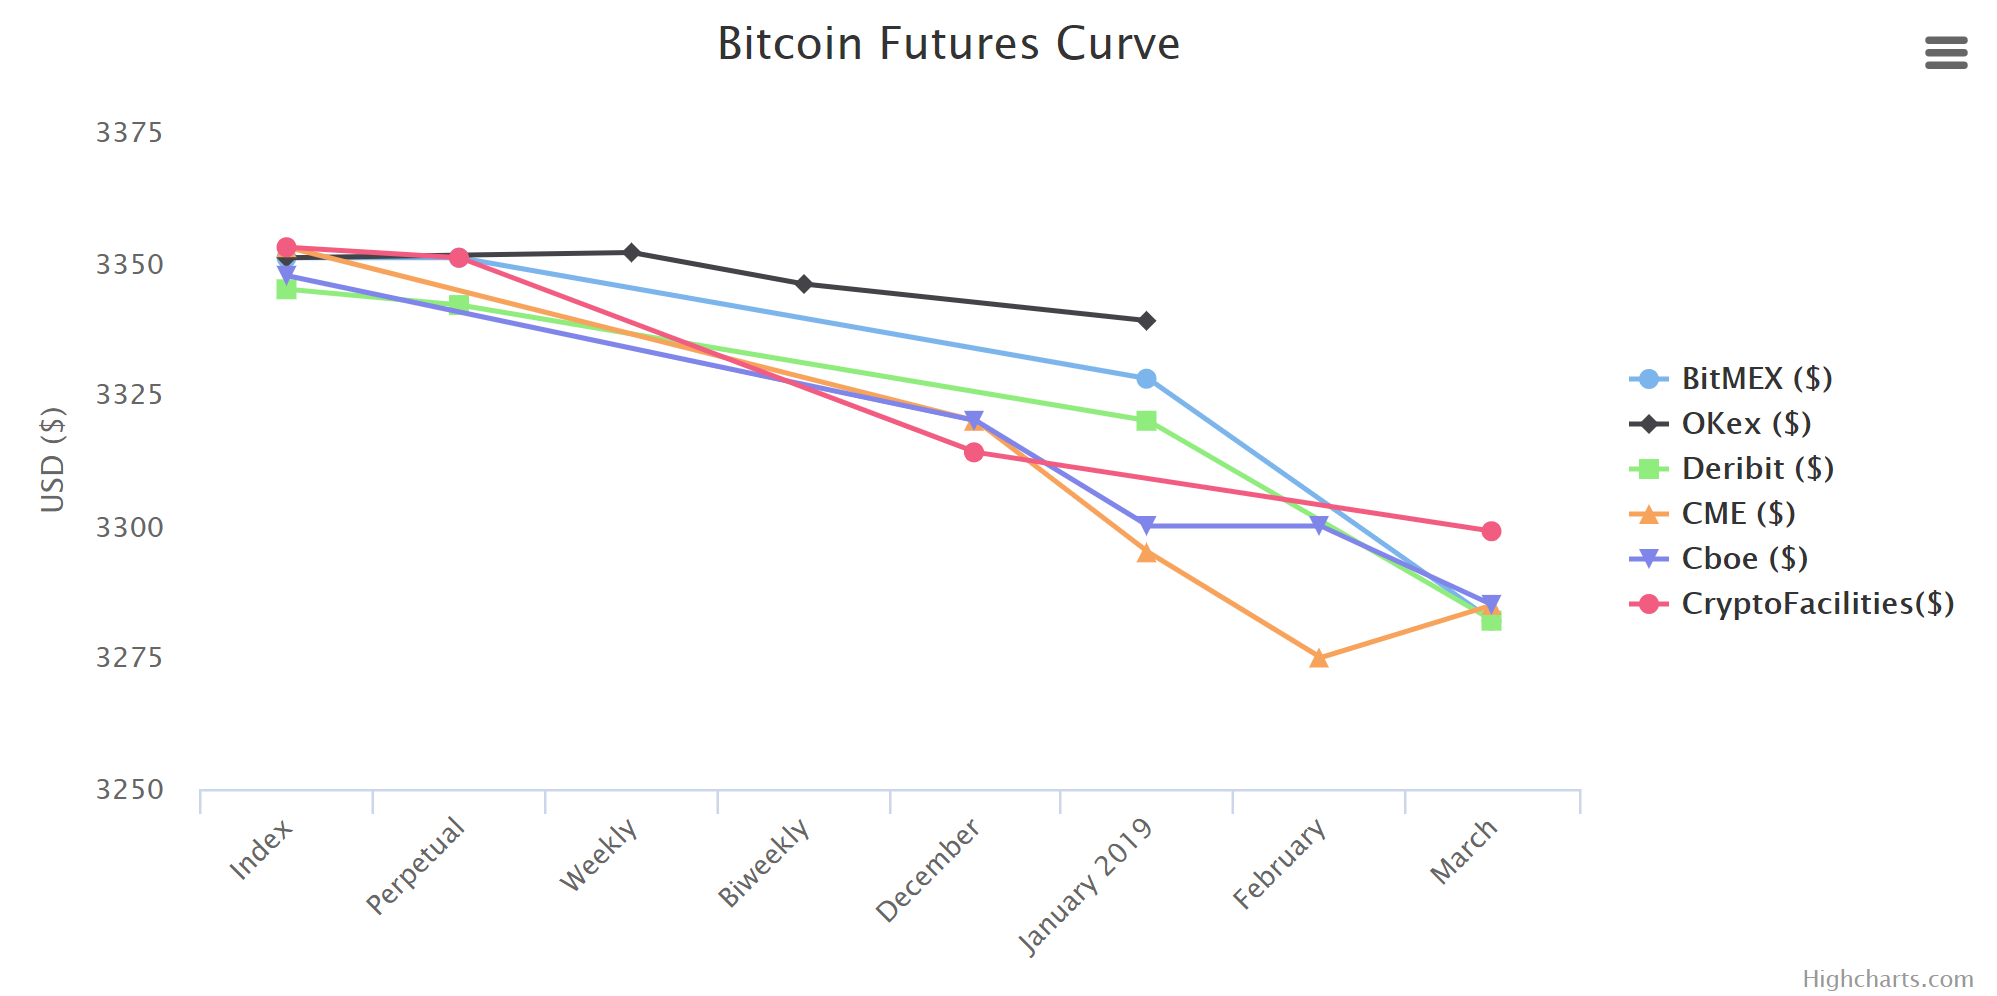
High Quality Indicators
Conclusion
Posted from Cryptotreat Cryptotreat : https://cryptotreat.com/when-to-buy-bitcoin/
It depends on your investment window. If it is more than 5 years, this is a great time to buy. If you are a speculator, the bottom may not be reached yet.