Ethereum (ETH) Analysis Aug 16th, 2019

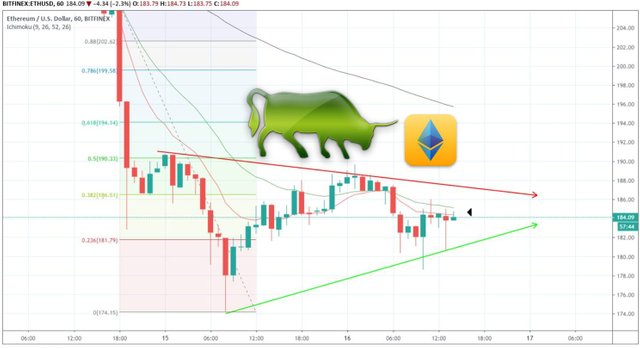
On August 11, 2019, the Ethereum price reached a low of $205. It traded inside a range of $205-$217 until August 14, when a rapid downward move ensued. The ETH price reached lows of $174 the next day. It has been increasing since then.
At the time of writing, it was trading at $183.
Will the Ethereum price continue to decrease or will it begin an upward move? Continue scrolling below if you are interested in finding out.
Buy and trade Ethereum and other assets with a 100x multiplier on our partner exchange, BaseFEX.
Ethereum Price: Trends and Highlights for August 16
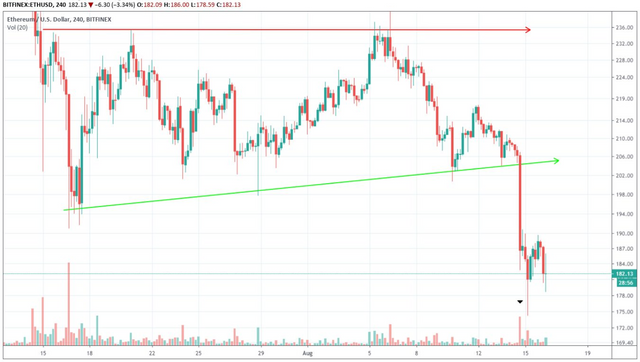
- ETH/USD broke down from an ascending triangle.
- There is support at $175.
- The RSI & MACD have generated bullish divergence.
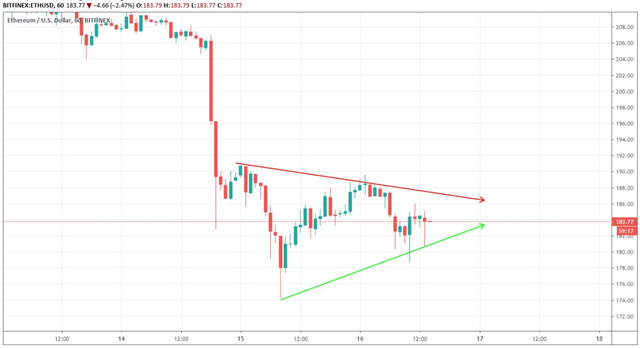
- ETH is trading inside a short-term symmetrical triangle.
Previous ETH Price Movement
A look at the four-hour time-frame shows that Ethereum has been trading inside an ascending triangle since July 15.The breakdown occurred with significant but not extreme volume.
Afterward, it looks as if ETH made a double bottom near $178.
Long-Term Support
A look at the daily time-frame gives us a support area at $175.
This is a suitable place for the initiation of a reversal.
Additionally, the RSI and MACD give a bullish sentiment.
Both have been generating bullish divergence since the middle of July.
Let’s take a look at the short-term to confirm whether this movement will transpire.
Short-Term Movement
A look at the hourly time-frame shows that the Ethereum price has been trading inside a symmetrical triangle since August 15.
At the time of writing, it was trading in the middle of the triangle.
The symmetrical triangle is a neutral continuation pattern.
Since it has been created after a downward move, a breakdown is more likely.
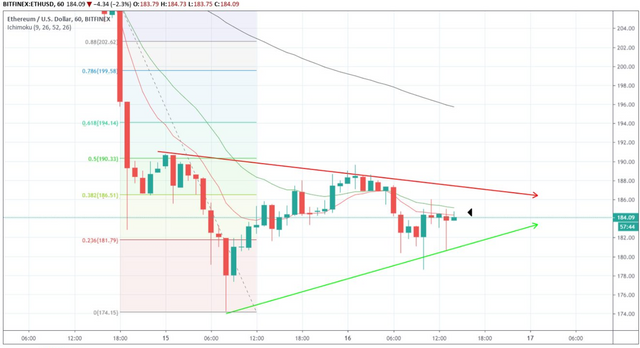
A look at the moving averages does not give a clear indication of where the ETH price might go next.
The price is trading slightly below the 10- and 20-period moving averages.
However, the long lower wicks that have been created suggest buying power.
If a breakout occurs, there is strong resistance near $194. provided by the 0.618 fib level and the 100-period moving average.
However, due to the previous price movement, we believe a breakout would only be a temporary movement, and the price will again reach lows close to $175.
Ethereum Price Summary
The Ethereum price is trading slightly above a significant support area inside a short-term symmetrical triangle.
According to our analysis, it is likely to break down from the triangle and reach the support area.
A short-term temporary upward movement could occur before.
Do you think Ethereum will break out from the triangle? Let us know in the comments below.
Disclaimer: This article is not trading advice and should not be construed as such. Always consult a trained financial professional before investing in cryptocurrencies, as the market is particularly volatile.
Images are courtesy of TradingView and Shutterstock.
Posted from Cryptotreat Cryptotreat : https://cryptotreat.com/ethereum-eth-analysis-aug-16th-2019/


Warning! This user is on our black list, likely as a known plagiarist, spammer or ID thief. Please be cautious with this post!
If you believe this is an error, please chat with us in the #appeals channel in our discord.