Bitcoin Price Dives To $9,100 But This Pattern Will Soon Rocket It Above $10,000

- Bitcoin price bearish leg extends below $9,100 after support at $9,500 was shattered.
- A possible double-bottom pattern could soon relaunch BTC/USD towards $10,000.
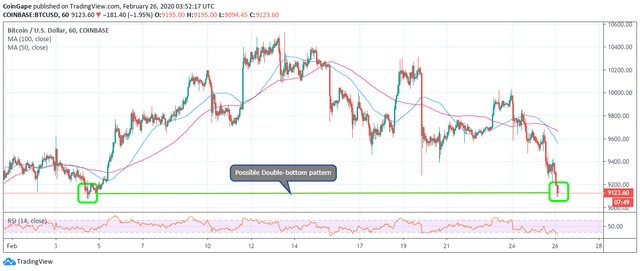
Bitcoin price is still exploring how deep the rabbit hole goes. Following the shattering of the key support at $9,500, sellers’ confidence shot up incredibly. Last week’s support at $9,300 did very little to stop the energized selling lot. BTC/USD extended the lower leg to $9,090 (intraday low). The price is down 1.84% towards the end of the Asian session, besides an attempt to pull the price upwards has hit a critical snag at $9,200. Instead, BTC/USD is exchanging hands at $9,142 while the trend remains inclined to the south and volatility levels are high.
Bitcoin Price Technical Picture
According to the indicators applied, BTC/USD is still under great duress and could dive farther towards the critical $9,000. The Relative Strength Index (RSI) downward slope within the oversold region doubles down on the heightened selling pressure. Similarly, the price is trading under the moving averages where the 50 SMA is exerting pressure at $9,563.70 on the hourly chart and the 100 SMA at $9,668. The visible and increasing gap between the two moving averages signals that sellers would stay longer in the driver seat.
BTC/USD hourly chart

Possible Double-Bottom Pattern
It is said that it gets darker before dawn. I believe Bitcoin’s ongoing declines would soon lead to a rally likely to blast past $10,000. However, the rally would depend on the ability of the double bottom pattern’s impact described in classical technical analysis. A double-bottom pattern is a reversal pattern that mostly breaks an extended downtrend allowing the bulls to take control as the sellers lose traction. Some of the regions likely to pose as selling zones during recovery include $9,200, $9,400, $9,600 and $9,800.
Bitcoin Key Levels:
Spot rate: $9,130
Relative change: -174
Percentage change: -1.84%
Trend: Bearish
Volatility: High
Image from TradingView
Follow CoinGape on social media handles and stay updated!
Telegram | Twitter | Medium