Bears Continue To Gain Momentum In Bitcoin – Are We About To Collapse?

- Bitcoin saw a 6% price fall over the past week, bringing the price of the coin down to $9,613.
- It is finding support at the short term .382 Fibonacci Retracement level, however, it certainly looks like the momentum is on the side of the bears at this moment in time.
Bitcoin has been falling ever since meeting resistance at the $10,400 level this past week. During the week, tt found support at around $9,600, however, it was unable to overcome the resistance at $10,190, causing it to drop and fall once again.
Things are now looking troublesome for Bitcoin after not being able to make any movement higher over the past few days. Despite all the latest price falls, Bitcoin remains up by a total of 11% over the past 30-days of trading.
Bitcoin Price Analysis
BTC/USD – Daily CHART – SHORT TERM

Market Overview
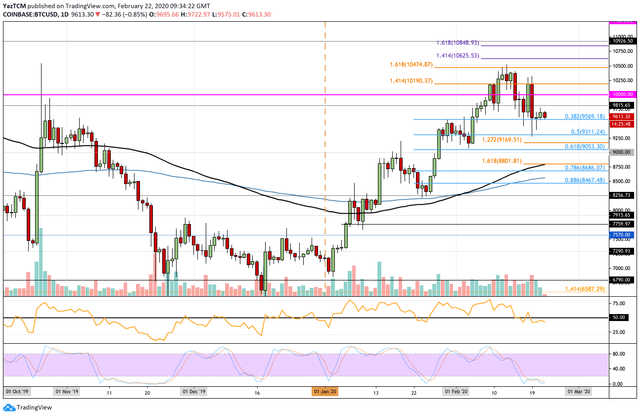
Taking a look at the daily chart above, we can see that Bitcoin has found support at the .382 Fib Retracement, priced at $9,569. During the week, it made a rebound and broke above the $10,000 level again, however, it was unable to break above $10,190 (previous 1.414 Fib Extension) which caused it to reverse and rollover.
Short term prediction: BULLISH
The cryptocurrency remains bullish, however, it is very close to becoming neutral. If it drops beneath the $9,000 level, we can consider the market as neutral. It would need to drop beneath $8,200 before we could consider it to be in danger of turning bearish.
Toward the downside, if the sellers break beneath $9,569 the next level of support lies at $9,311 (.5 Fib Retracement). Beneath this, support lies at $9,159 (downside 1.272 Fib Extension), $9,053 (.618 Fib Retracement), and $9,000.
On the other hand, if the buyers rebound here and push higher, resistance lies at $9,815 and $10,000. Above this, additional resistance lies at $10,190 (1.414 Fib Extension), $10,474 (1.618 Fib Extension) and $10,500.
The RSI dipped beneath the 50 level and remained there for the longest period during 2020. If the RSI is unable to climb back above 50 pretty soon, we can expect the moment to shift and for the bears to regain control.
Key Levels:
Support: $9,569, $9,311, $9,280, $9,200, $9,169, $9,053, $9,000.
Resistance: $9,637, $9,615, $9,815, $10,000, $10,190, $10,360, $10,474.
Image from TradingView
Follow CoinGape on social media handles and stay updated!
Telegram | Twitter | Medium