Predicted Crypto Breakout Prices
- A significant number of altcoin BTC pairs are setup for a breakout.
- Identifying some of these pairs that are most near these zones allow us to get in early and capture gains ahead of everyone else.
Cardano (ADA)
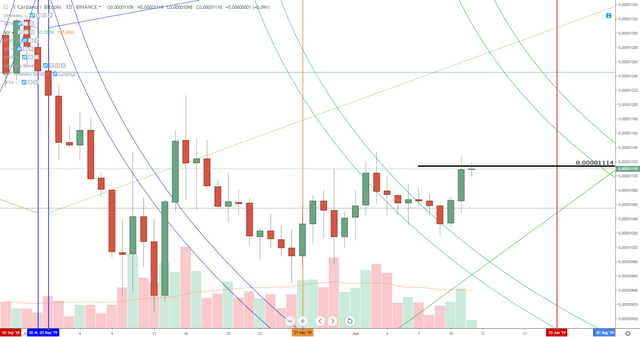
Cardano’s Bitcoin pair has seen some excellent and bullish drives over the past two trading days. On Monday, June 10th 2019, Cardano moved up against Bitcoin by +3.19%. And today (June 11th, 2019), Cardano had one of its biggest swings of 2019 by trading in a range from a swing low of 0.00001047 to a swing high of 0.00001127 – ultimately closing for a +4.03% gain on the day. The close was just below a key and strong resistance level at 0.00001114. Cardano has traded above this level, but we ultimately need to see Cardano close above that zone to initiate the next big bull run against Bitcoin. A predictable US Dollar value would see Cardano trading around the $0.10 to $0.11 value area on any sustained break above 0.00001114. Traders should be aware that June is an extremely important month for Cardano – it is expected that the testnet will be launched this month. This would be a significant and insanely bullish event for Cardano. I would expect to see 2x to 3x multiple gains on the present value area when this occurs.
Basic Attention Token (BAT)
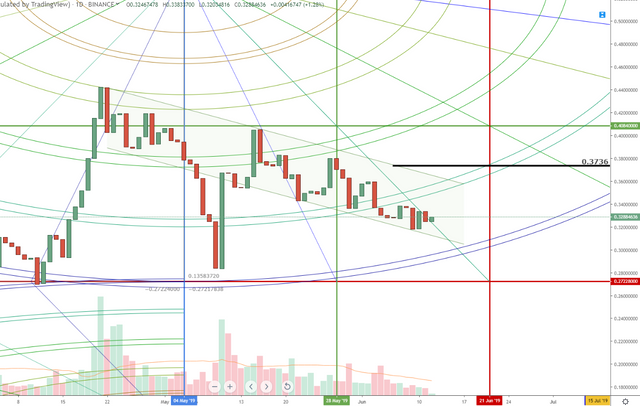
As I discussed in my most recent article, Basic Attention Token’s chart is best viewed when it has the wicks removed from the candlesticks. This time I drew the channel for the bull flag. For those new to my articles and for those who are unfamiliar with what a bull flag is: it is a bullish continuation pattern. Basically, it means that prices have a high probability of moving higher if price can breakout above the current flag/channel. Predicting and forecasting the breakout of any flag pattern is easy once the pattern has been established and identified. Flag patterns have one the highest probabilities of continuing a prior trend than any other type of pattern. In Basic Attention Token’s case, there is actually three pieces of technical analysis that could initiate a break of the bull flag. First, is the current daily support against the 1×3 angle at 0.3285. When price is trading at this angle, it means it has moved twice as fast in price as it has in time. The 45-degree angle is above price near the 0.42 value area – which is the equilibrium value. Essentially, price has an easier time moving higher than it does moving lower. The second piece of analysis is the Gann arc up above near the 0.35 value area. A break of this arc would bring prices into a new trading range and well into the low end of that range to break higher. And thirdly, we have the value area just above the current flag pattern at 0.3736. It is that value that I would predict price arrives at before then initiating another fast and swift move higher – more than likely putting pressure against the $0.5 zone.
I am all in Ltc expecting it to break out before the week runs out as Halving draws nearer. Also expecting a break out on veil as we have been on the 0.12 region for almost a month now.