$VEN #VeChain - FULL ANALYSIS - a perfect 2 possibility example

Hello Lads and Ladies,
Today, as 100% requested, we will be taking a deep look into VENBTC. Unbiased, since I am not holding any YET and thorough since it is one of the more interesting charts!
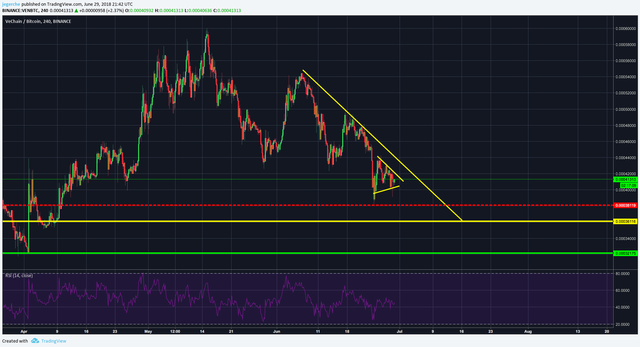
We will start off with the 4h view on it to have a brief knowledge of the situation here.
We can see here a clear downtrend since June 7th when the market started blood bathing. The first interesting point here seems to be that it is very heavily influenced by the market movement but still has a strong pull upwards, since it has been bouncing everytime about 10%.
Right now VENBTC is forming a wedge and will decide where it is headed next. There is room and possibility for both ways, even though it seems to depend highly on the overall market.
Should the market bounce within the next 48h, then it will be an easy game with VENBTC taking profits at S/R lines.
The more interesting part is though the bearish scenario and we can already see some lines here (especially the 0.00038 and 0.00036) but lets take a look why these lines are so important.
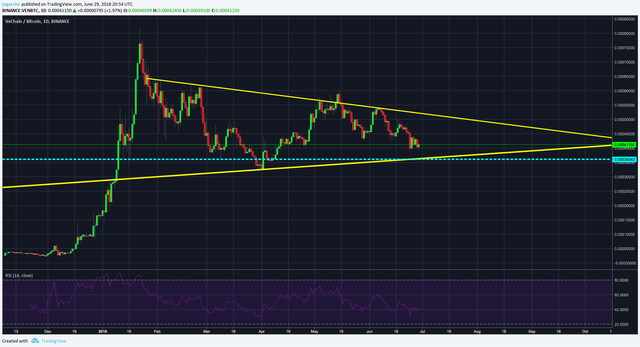
Taking a look at the daily chart, we can clearly see a decreasing resistance and an increasing support.Just from looking at that we might see the next bigger stop at 0.00036 if VENBTC decided to go down.
Here again coming down to support would mean hitting the 0.00036 support and the uptrend support, which in my opinion is a huge bounce sign.
Moreover, this would be the third "deep" retracement this month, as we know many cryptos retrace in 3 steps. VENBTC has actually done that a few time before (take a look at the retracements).
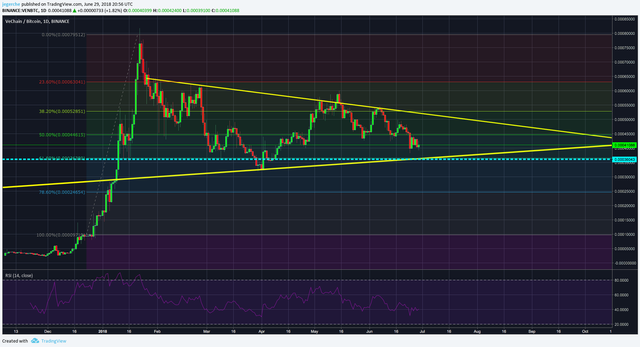
So now on the daily, we apply the fibonacci retracement and see once again the 0.00036 line being the 61.8% line from where VENBTC has bounced before.
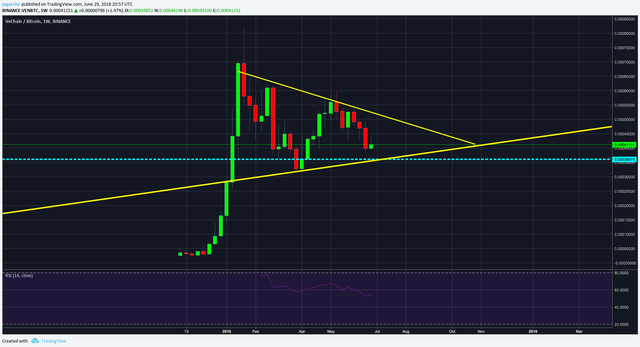
Here, on the weekly chart of VENBTC this 0.00036 line makes perfect sense, looks great, almost like in a perfect world.
But here comes the fun part to it.
Have you questioned the uptrend support during this analysis. As it has been right now, I readjusted it at the second time because as I saw it the first time, it perfectly made sense.
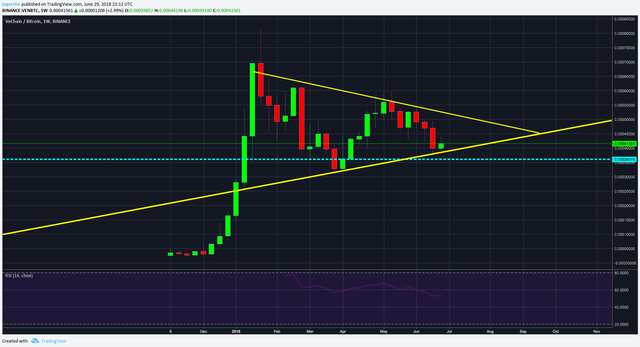
I have set it like that because the candle right now is green and it SEEMS like if VENBTC has just bounced and will continue the bounce. ANYHOW, this candle has not closed yet and therefore we cannot say right now what is or will be happening, we need to wait until this candle closes.
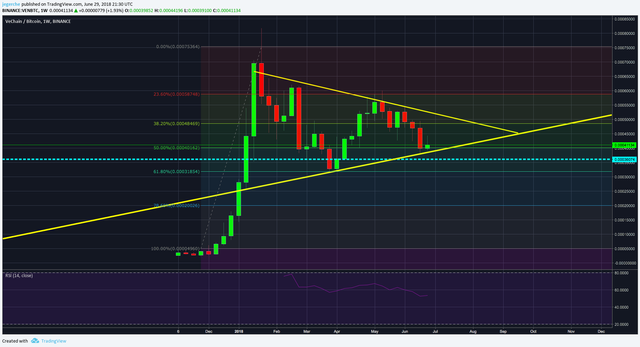
ALSO, with the fib applied (just a little further down) we would see here a first bounce from 61.8% to the resistance, then down to 50% AND the uptrend, form here probably a bounce again to resistance.
So, to stop this hide and seek game, here is what I think will happen. As you probably can guess there are two possibilities.
- We close this weekly candle ABOVE previous open and will actually have a bounce towards the resistance. Here, once again an interesting fact, we had either two green candles (small followed by a big green candle) or 6 green candles in a row. So basically, if this week is green, the next week is most likely green and if the third week will be green too, we will have actually reversed the trend and then continue pushing upwards most likely again in a 6 week time frame.
(Yes, I do not pay attention to the single green candle in May.) - We will close as red (OR green) and then continue down to 0.00036 for a bounce off the 61.8% fibs and the uptrend support.
2.5) The marke will go down more, with it VENBTC. It will find its bottom at the same level of support 0.000315 (as well the 61.8% fibs line - second option), will there have a pretty nice double bottom and then bounce and reverse the trend from there.
I am going to put buy orders in at all of the mentioned support lines. -> 0.00040(for right now)/0.00036 (for the first option)/0.00032(for the second option). 20%/55%/25% (of the capital assigned for this trade).
In my opinion we will see VENBTC make a third retracement to either 36 or 32 and from there on a bounce and a break of the trend. The possibility that it will bounce right now and hit resistance next week is for me only possible if the whole market has a nice "green week".
Make sure to check it out on Tradingview - https://www.tradingview.com/u/jegerche/
Instagram - https://www.instagram.com/bitcoin25.de/
Twitter - https://twitter.com/mreucho/
 me and you will find this page interesting because I am a TA expert and day trader that does daily updates and new posts about the hottest and most discussed coins.
Cheers, Tomas