$ETH #ETHBTC Daily Extensive Technical Analysis - Day Trader Explains

Hello Lads and Ladies,
Welcome back to TJ's daily TA. Today the TA has been requested by the traders of School of Sparta, we are taking a look at ETHBTC on the exchange Bittrex to see if it a good point to buy right now or not. The equivalent to the Bittrex ETHBTC price would be on BitMex the contract ETHZ18.
Against BTC value ETH has just had the worst months ever and the question right now is, will Ethereum bounce or will it fall even more?
We will answer this question with an extensive technical analysis in the following. Using again, Horizontal support and resistance lines/zones, trend-lines, trend-angles as the main source of TA. Indicators are added at the end to confirm the findings.
Lets jump straight into it.
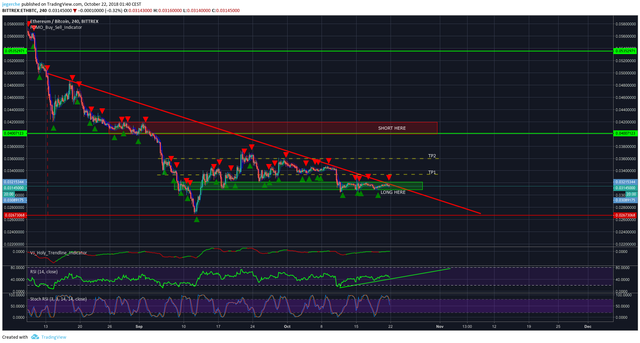
The first thing falls immediately in my eyes is that we have now finally found a pretty nice support zone, that we saw ETHBTC actually bounce from and not just have small bounce and then break down almost right after it.
Seeing this, makes finally sense to start any kind of TA.
After finally bouncing we have indicated a pretty strong buy-zone for ETHBTC. Within this buy-zone there have been multiple opportunities to LONG or BUY ETHBTC and sell it again with some nice small gains, especially with leverage.
The selling points are basically throughout valid and are in the form of a horizontal support, indicated here with the dotted lines.

Now, continuing to surprisingly very few trend-lines and trend angles especially on such a "big" coin. The lack of possible and obvious repeating trend angles indicates a lack of "staying" traders. It is more an indication that people hop in and out of it to make "a quick buck" which is not wrong, especially when we have such an obvious and strong "rinse and repeat" trading zone for it. I am teaching about rinse-repeat trades on our group of course, where and how to find it. Anyhow, the only very obvious trend-angle I was able to find was an downtrend which is actually valid since multiple months (indicated with the big red downtrend line). Everything has been bouncing up to it and then getting rejected. Now, we are in a position where we are very near to the downtrend resistance line YET not because of bounce but because of a sideway movement. Normally, (as we also see with a lot of coins) this boy should have crashed way before but is has not and it is going sideways, while staying at the same support buy-zone and just waiting for a move. This is what you normally would call "ACCUMULATION"..
How does this accumulation work?
Well, taking a look to many other markets, this type of price movement ends when the accumulating capital is "gone" (in the coin) and then everyone who has been accumulating starts pushing it. There you most likely see an impulse move upwards, followed by a small take-profit movement by the accumulators and then the next big impulse move by FOMOers and new people gaining attention to it.
HERE comes a very interesting fact into consideration.. the flat price but constantly rising RSI from below 20 points all the way up to 50 points and even above. THIS is what you would normally call a bullish divergence, which then again is also and indication for a soon impulse move.
BUT FOMO is showing sell and StochRSI is going down, why do you want to long?
I would say, be happy that it is going down a little so you can fill your nice entry orders and then thank me later. Just because indicators are going down, you have to know in what case it is only for filling your orders and in what case it is actually trending down. In this case we have not a trend down but rather a hidden trend upwards.
Is it already over will it moon NOW?
Most likely not. Give it a few days and then lets see where the price is then.. as long as Bitcoin is not having another bigger move down, we will have a nice push on all coins upwards.
So based on the TA above I am making a trade call
ETHBTC / ETHZ18
LONG (max 10x)
Staggers - 3125 - 3100 - 3050 3015
Targets - 3215 - 3333 - 3600 - 4000
Stop Loss 2950
Long term and low leverage would be 5350 a good target.
Should Stop Loss hit, it will most likely go to 2675 and bounce there again (long opportunity).
Register for our VERY elite and personal Elite Trading Group under
https://www.crypticbt.com/elite-group
Follow me on Twitter under
https://twitter.com/mreucho
Join our Discord under
https://discord.gg/Djcxgkh
Join my Tradingview under
https://www.tradingview.com/u/jegerche/
Join my Instagram under
https://www.instagram.com/bitcoin25.de/
 me and you will find this page interesting because I am a TA expert and day trader that does daily updates and new posts about the hottest and most discussed coins.
Cheers, Tomas
Congratulations @bitcoin25! You received a personal award!
You can view your badges on your Steem Board and compare to others on the Steem Ranking
Do not miss the last post from @steemitboard:
Vote for @Steemitboard as a witness to get one more award and increased upvotes!