Is this the final bottom for $QTUM???


Hello Lads and Ladies,
Today we will be taking a look at QTUMBTC. A very interesting coin with high potentials. Nevertheless the key question is as always, when and where.
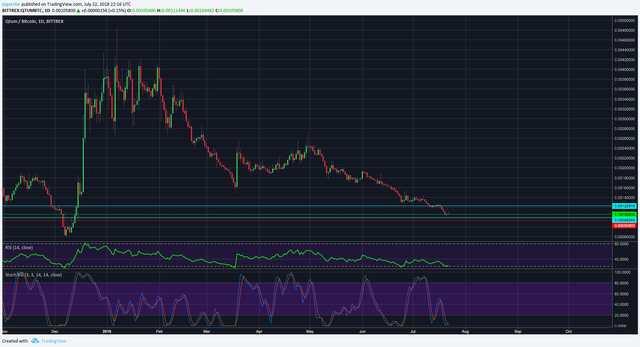
To keep this just as long as it needs to be, we will take a look at the daily chart. Here, we can see very easily that QTUMBTC has been in a very steady and strong downtrend since the beginning of the year and has not bounces many times.
Right now we are it hitting at substantial support lines, which tend to be questioned and broken in the last few weeks.
To have a better understanding and look at it we will change now to the 4h chart -

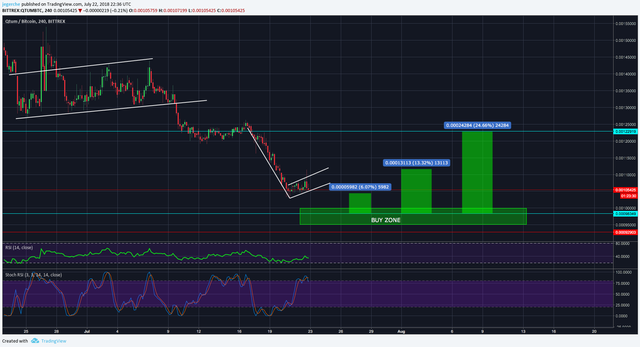
Here we can see the outtake of the last month on the 4h chart. It shows us that the downtrend is strong and we have basically one bear flag after the other respecting support lines for a few days and a strongly decreasing volatility.
Once again we are right now within a new bear flag that we are basically looking to break towards the next support and buy zone. This buy zone is set there because it strongly looks like that it is very likely hitting a strong support and an historical average range from which it has been experiencing huge bounces.
To be more exact, we are right now at the area of 105k satoshi and are looking to hit the next support of 98k. In favour of this support we have as well a strong psychological support at 100k satoshi. Buying QTUMBTC in this area would actually be a good starting point for a long term (4-6 months) investment, since the long term targets are way above 500% for QTUMBTC.
Nevertheless, we are looking for short term trades and a trade off this support line with a relatively tight stop loss is looking pretty good. Depending on the market moment and the structure it creates, the targets lie between 7% and 24%.
Now, taking a look at the indicators, which depict the historical average range mentioned before, we can clearly see them being in high favour to our expectations.
Looking at the 4h RSI, we are right now located at 33points which leaves us still a little space to the 20 point line, which has been letting QTUMBTC bounce many times before. Taking a look at the Stochastic RSI, which basically gives us a glance behind the scenes of the RSI indicator, we can see it being located at a pretty high level, which shows us that it is very likely for it to go down. Here the expected bottom of the Stoch RSI would be equivalent to the 20point RSI and the range of 100k to 98k satoshi.
Yet, why should we be seeing a bounce now? The daily indicators, show us the reason.
Looking at daily RSI we are located at 22 points which is very near the 18point line, which almost always lets us expect a bounce of at least 20%. Moreover, looking at the Stoch RSI we are very clearly at the bottom, even about to form a double bottom, speaking in favour of the expected bounce.
The small range of the daily indicators are exactly equivalent to the little range o the 4h indicators, which would then give us multiple timeframes being located at a very substantial bottom and very strong supports.
IN NUMBERS -
- BUY @100k-95k
- SELL @105k - 111k - 120k
- SELL @ leave a small chunk for above 120k if it still looks bullish.
- SL @92k-90k
Make sure to check it out on Tradingview - https://www.tradingview.com/u/jegerche/
Instagram - https://www.instagram.com/bitcoin25.de/
Twitter - https://twitter.com/mreucho/
 me and you will find this page interesting because I am a TA expert and day trader that does daily updates and new posts about the hottest and most discussed coins.
Cheers, Tomas