An Algorithmic Playground
This is going to be a bit of a different post (a rather long post so be warned). Rather than being a TA, this post is going to be delving into the algorithms that run most of the price action and show how often they achieve their end goal.
Algorithms haven't been around for that long, the first computerised order flow originated in the 1970s on the New York stock exchange. Algorithmic play in the crypto market is a bit different than in the stock market. Because the market cap of some coins are relatively low and are also owned by a few large players, you can see how easily a market can be manipulated. For an example, take the Basic Attention Coin (BAT), the top owner owns a staggering 23% of total coins available! If they deploy an algorithm to automate their trades, not much is going to stop them.
For this example I will be using NEO.
I will be making my way through the on-going correction, drawing fib extensions from swing highs and lows detailing the possible targets. I am sure I missed lots of pivot points but hopefully you get the general gist.
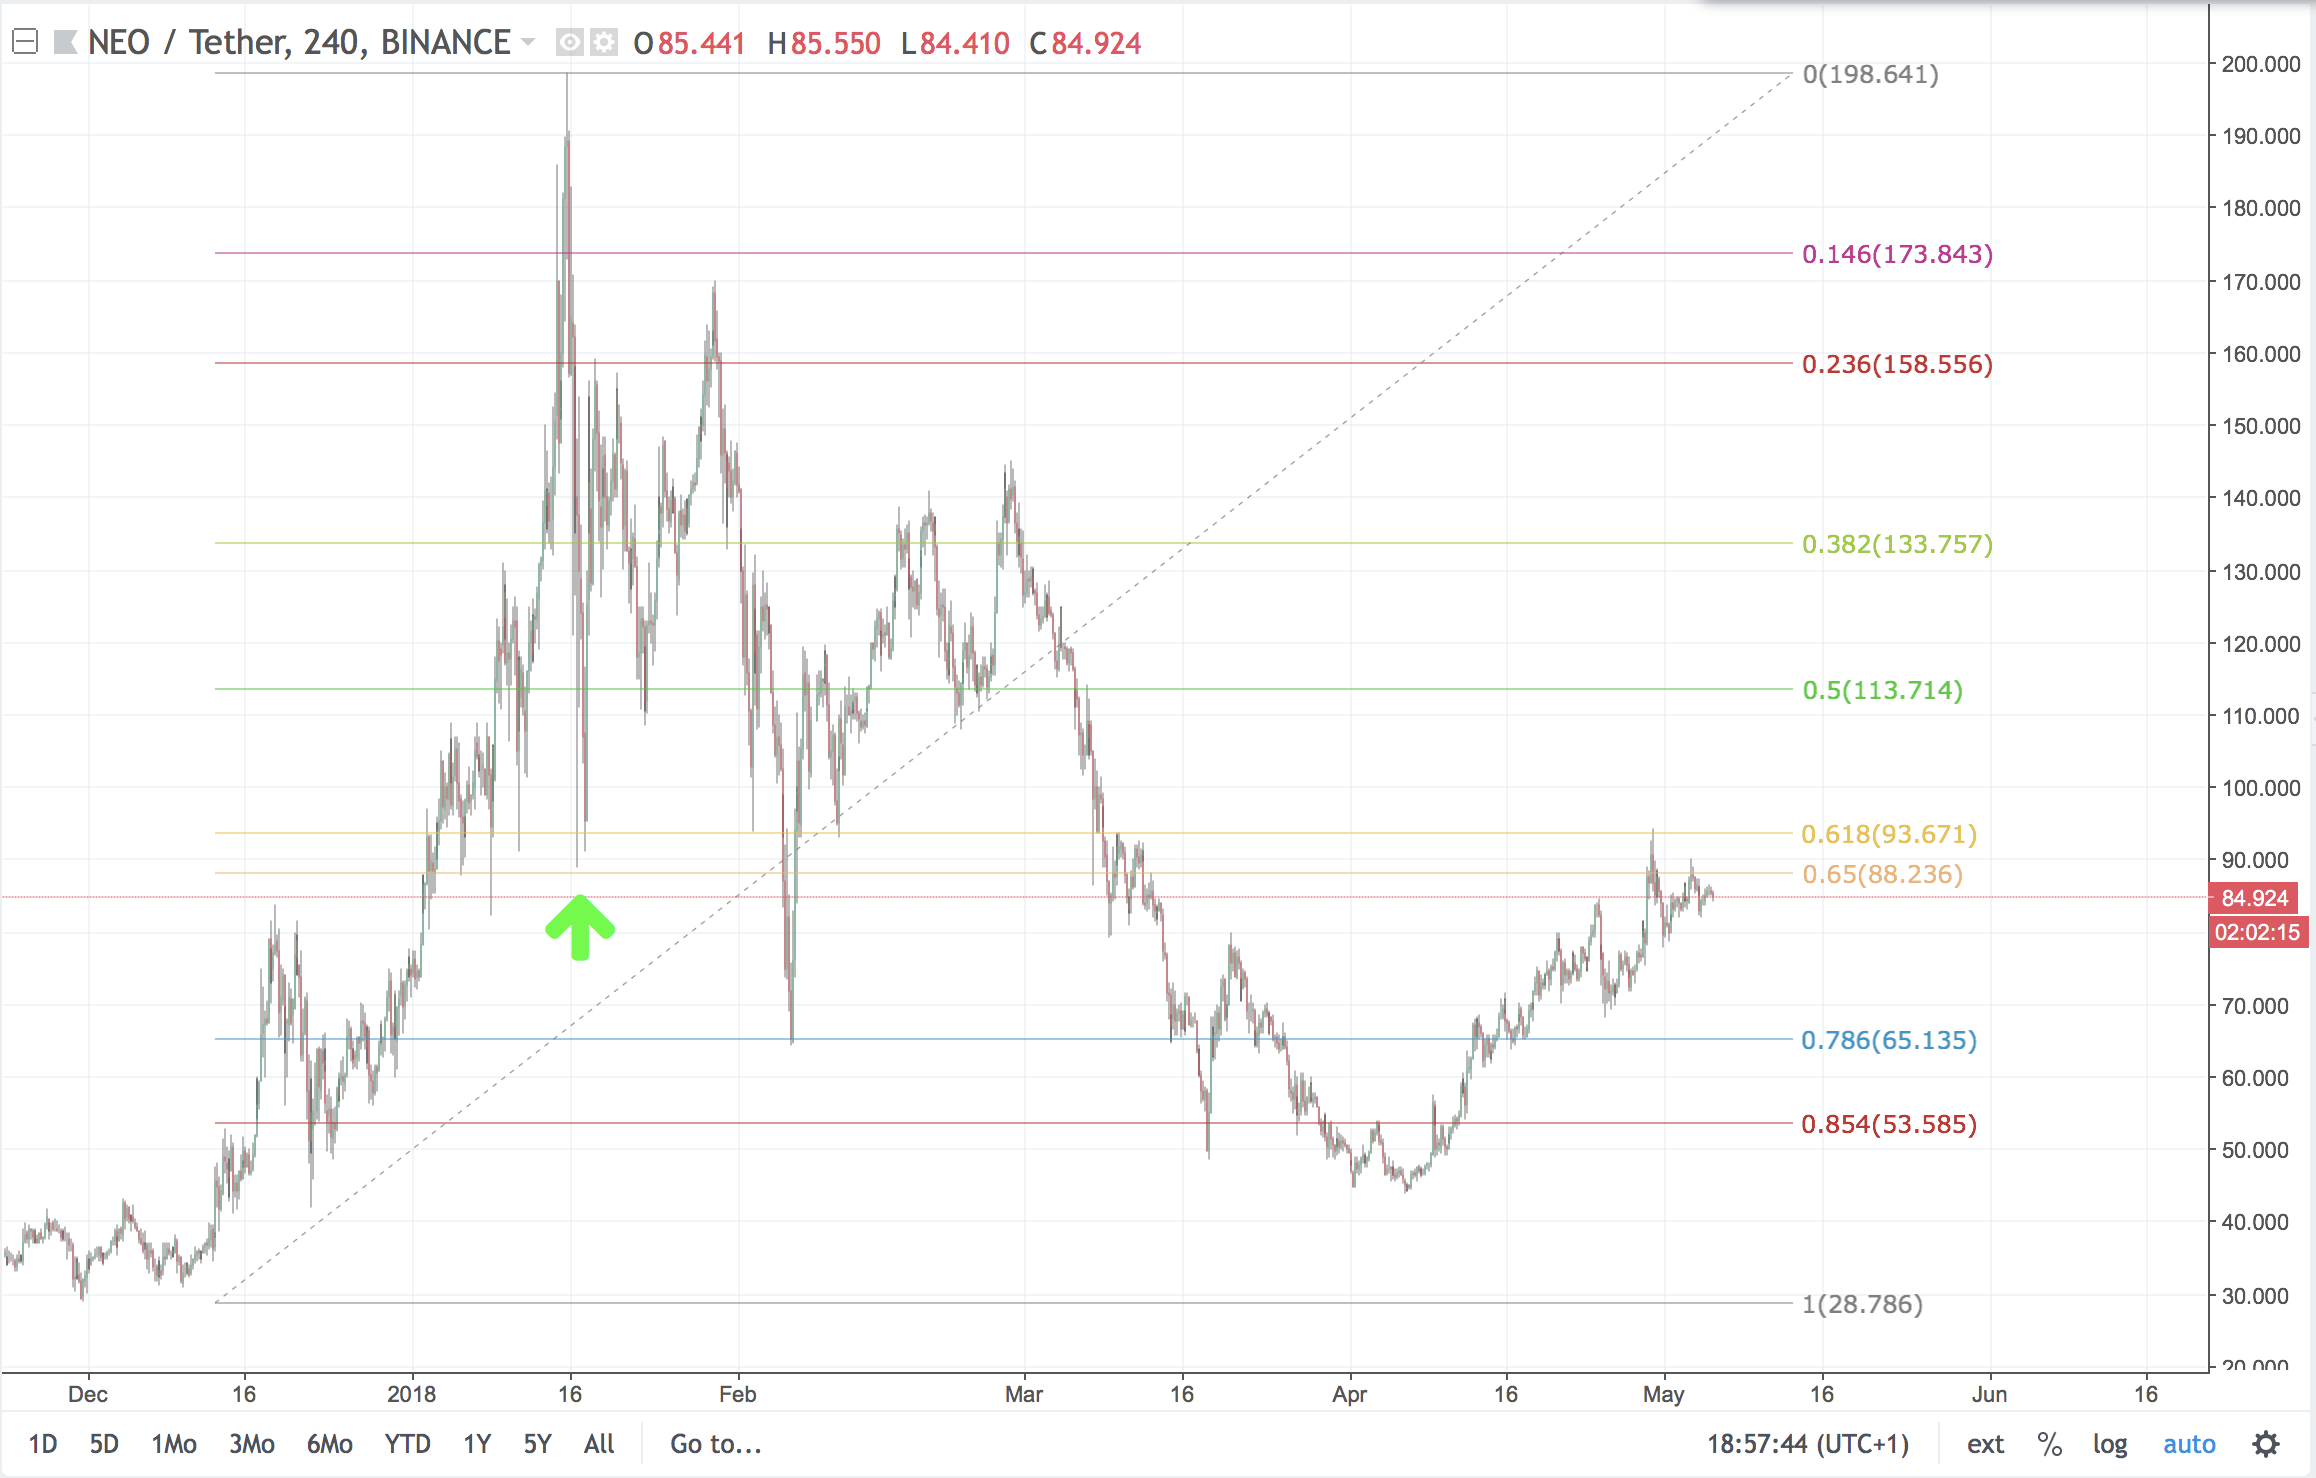
The first pic below is just the most recent swing low before the ATH drawn up to the ATH. You can see that the first target is the golden zone and it does that perfectly, flawlessly bouncing off the 0.65 line.
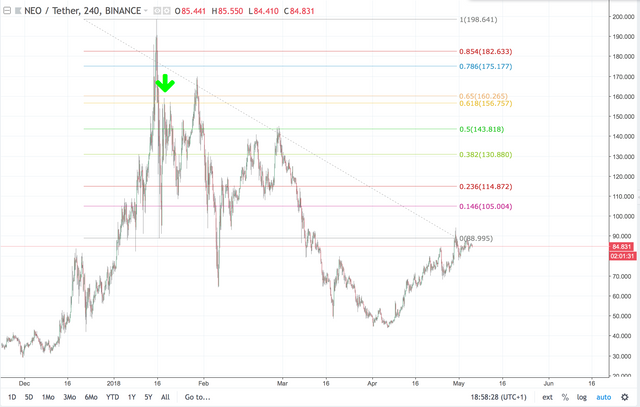
To see where the next target is, I drew a fib extension from the 0.65 bounce back up to the ATH. We then see another perfect wave to the golden zone.
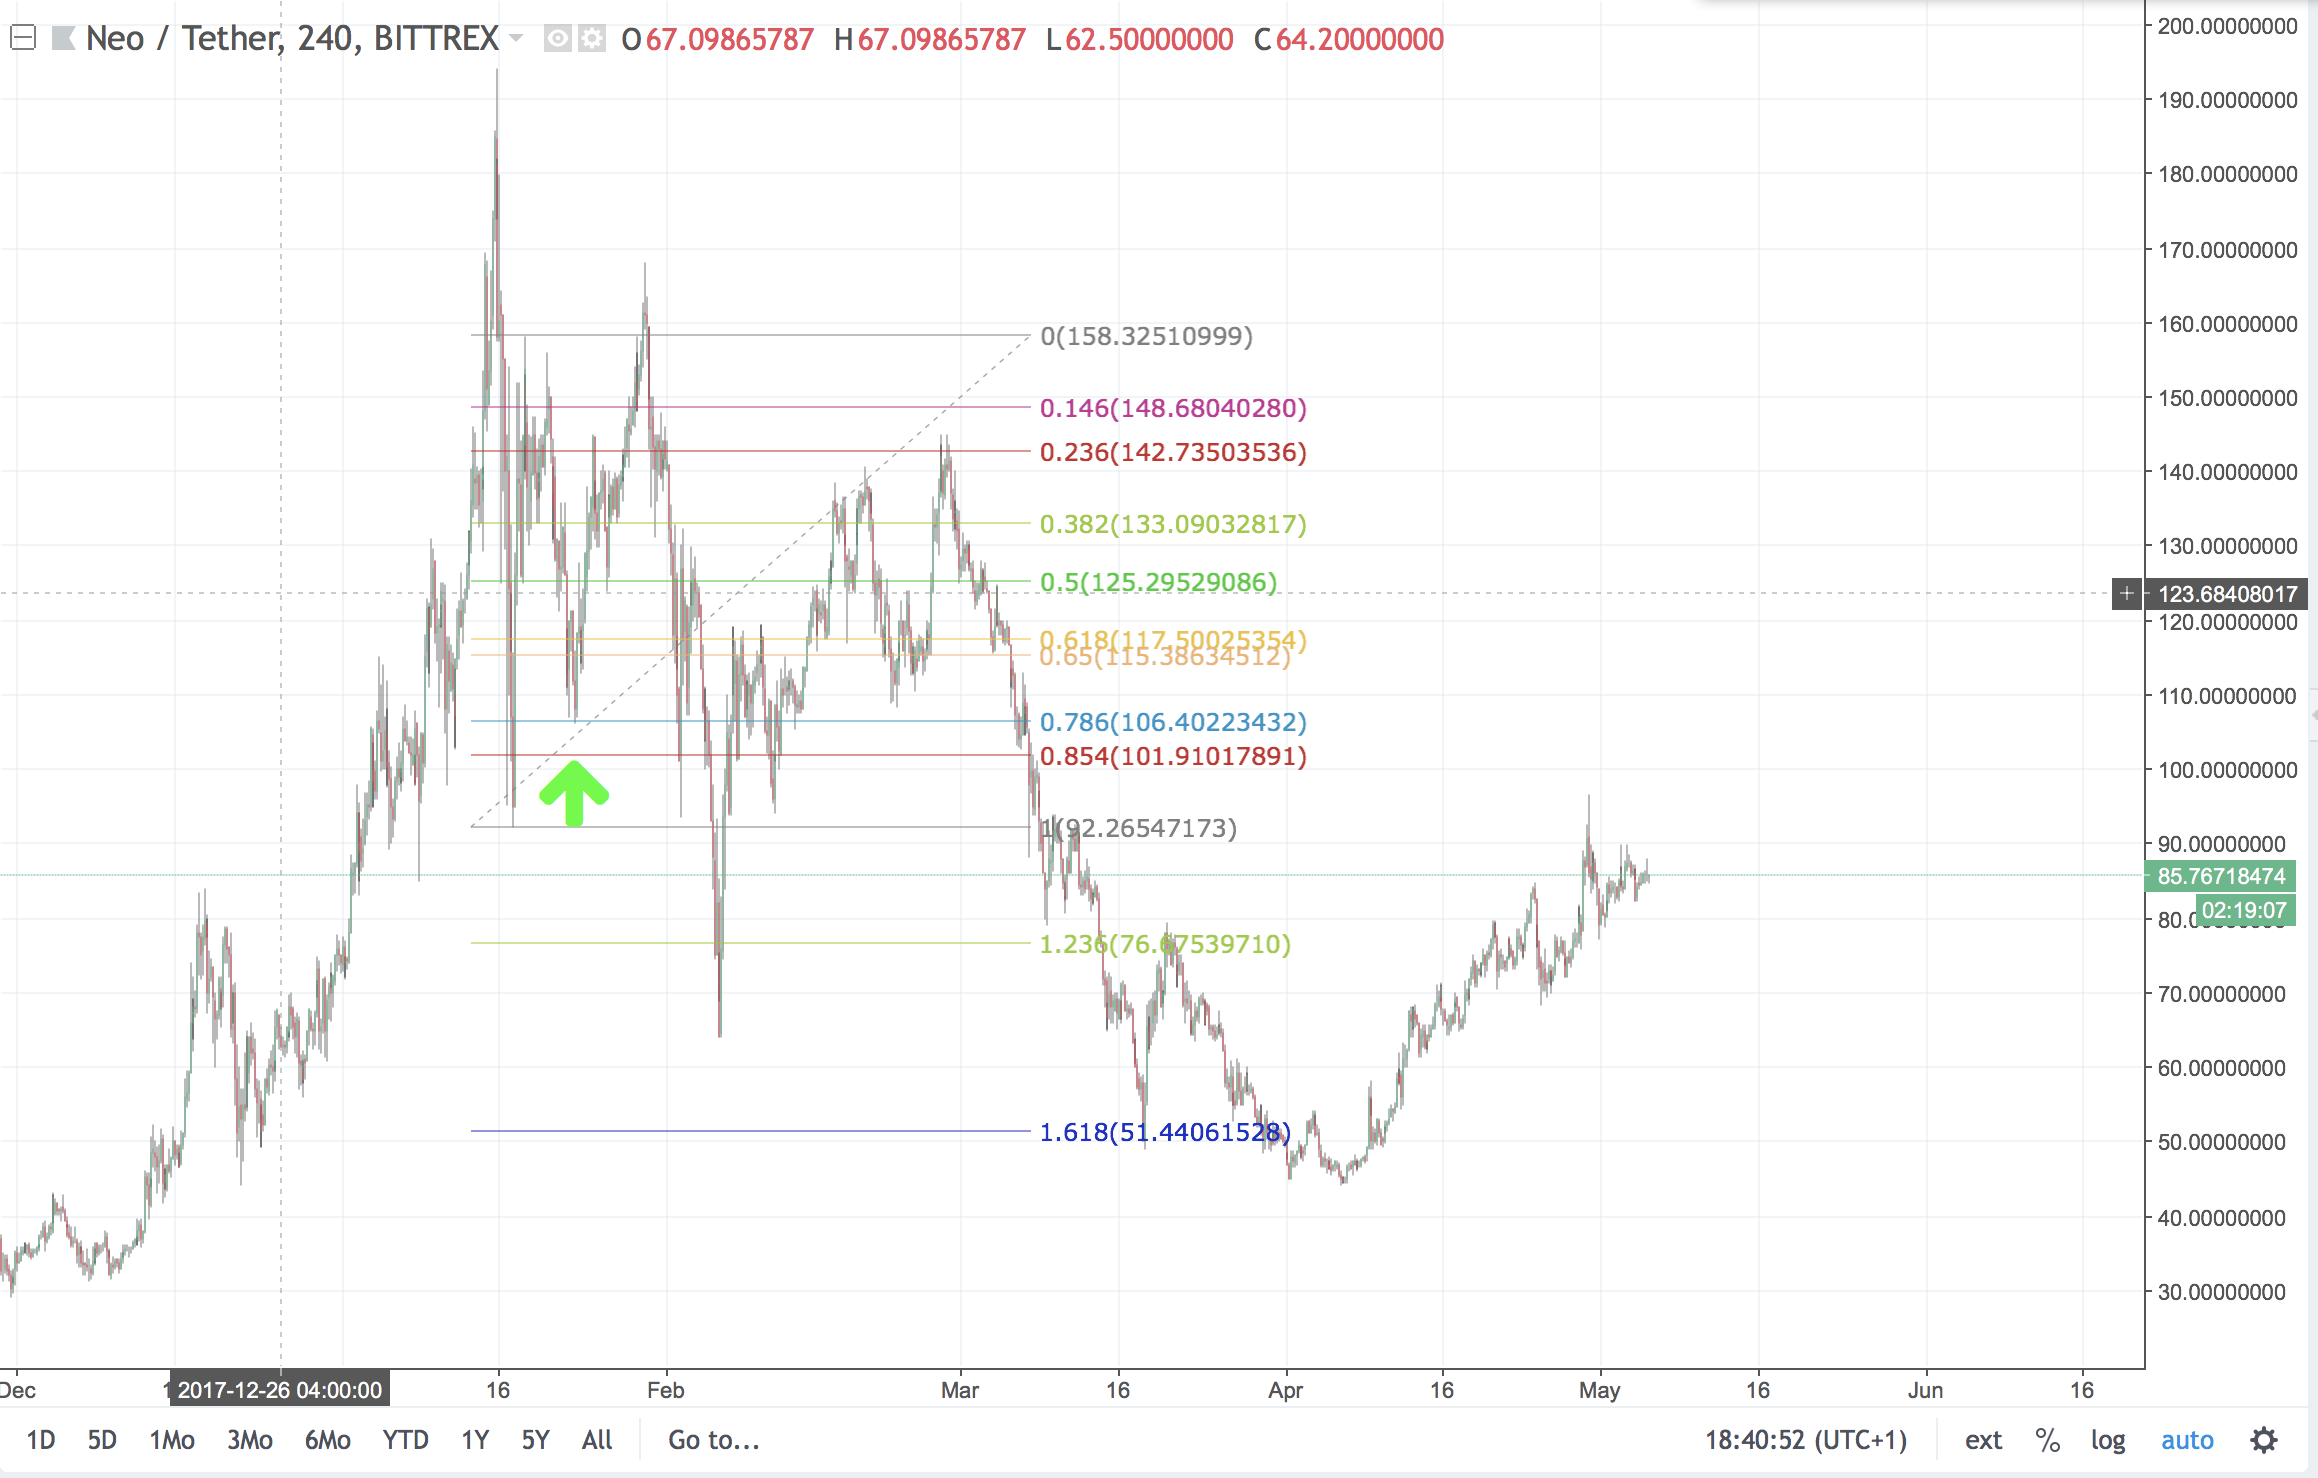
At first I couldn't see any obvious algo activity, none of the lines were showing obvious target zones. I searched for other sites that support NEO/USDT and Bittrex came up. I tried the same fib again and we can see a perfect 0.786 retracement.
Next we push back up past the recent high and reach the 1.236 target.
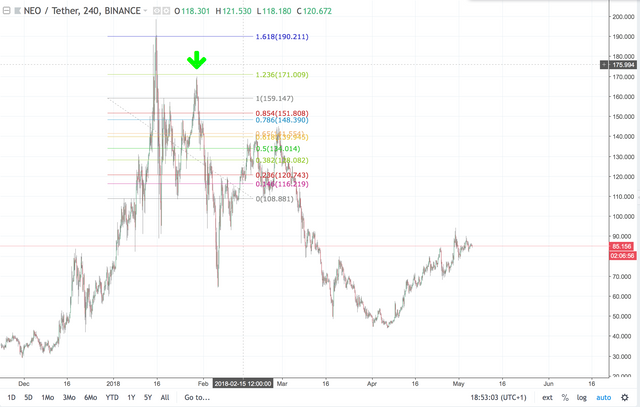
This is where it gets really interesting. There are now multiple algorithm targets focusing on an area. We see a perfect 0.786 retracement from the ATH and a front run on 1.236, which was drawn from the last two swing points in the previous two graphs.
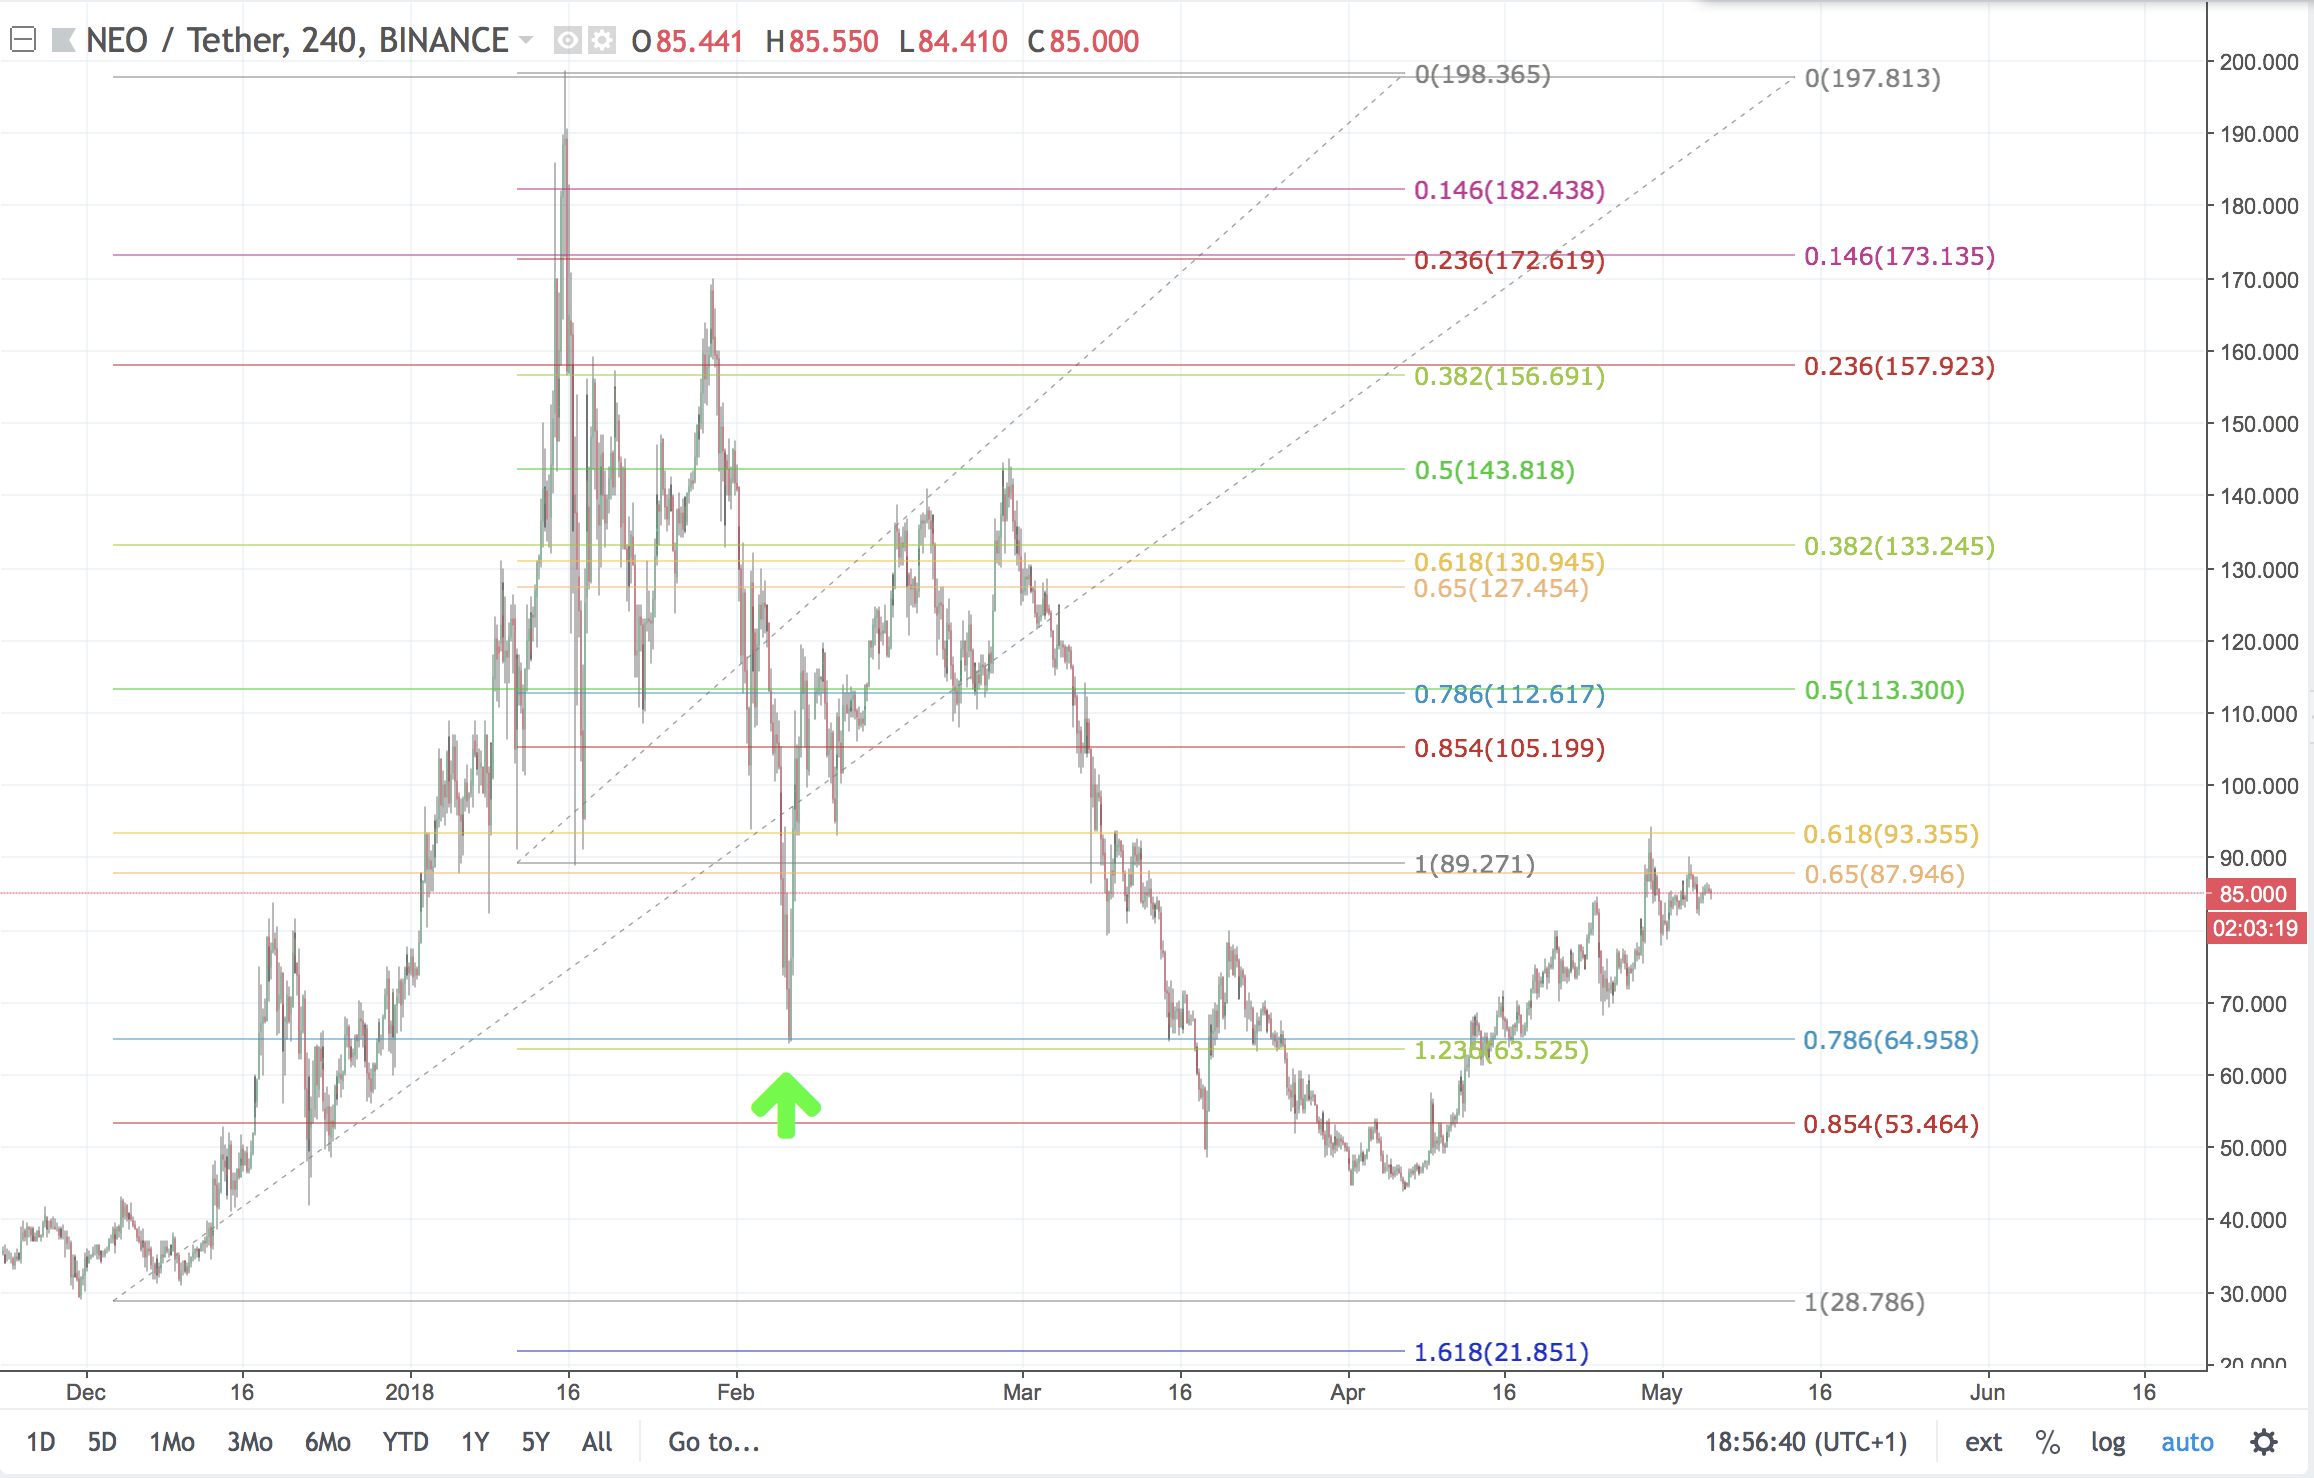
We then see another confluence of targets below. This marks the point the impulse wave finishes (see the second bearish prediction in the last Neo post or the next graph where I put a count on). From here we have a straight rip down but we do see two nice bounces from both 0.864 levels.
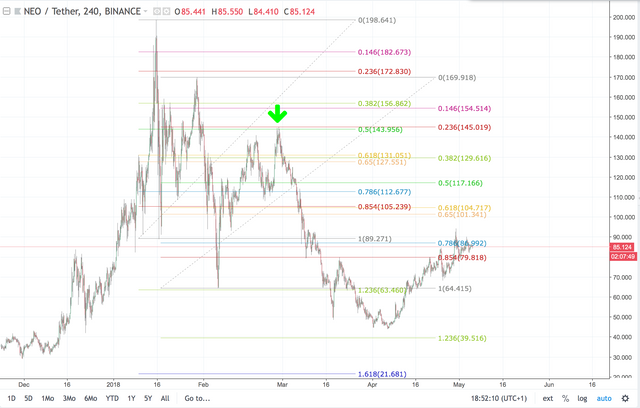
The graph below shows a possible count (this is more so I could name different sections of the graph rather than an actual analysis), I found the two pivot points by just playing around with a few swing points. The first arrow marks a 0.854 retracement drawn from the original swing low up to the X wave. The bounce then only pushes up further until it reaches the resistance of the 0.5 line, this was drawn from taking a fib extension from the ATH down to the first C wave and then back up to the top of the X wave.

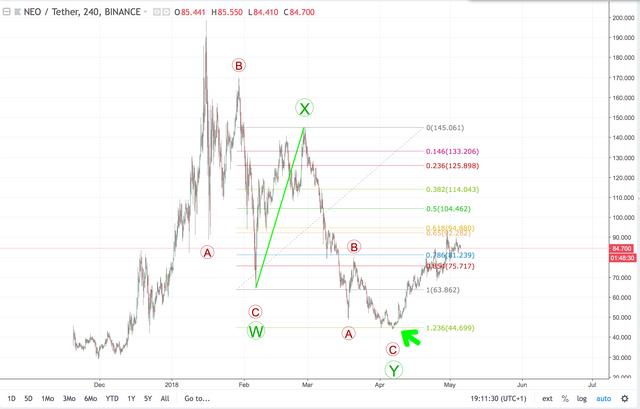
Okay last graph now, I promise. This is the most recent swing low and the furthest Neo has currently corrected. The fib levels were just drawn from the W-X impulse wave.
I hope this post sheds some light on how important it is to learn both Elliot Wave Theory and Fibonacci levels. Then you will have the tools to predict the path of a coin by working out probable algorithm targets.
Thanks for reading!