STEEMUSD... you knew it was coming...
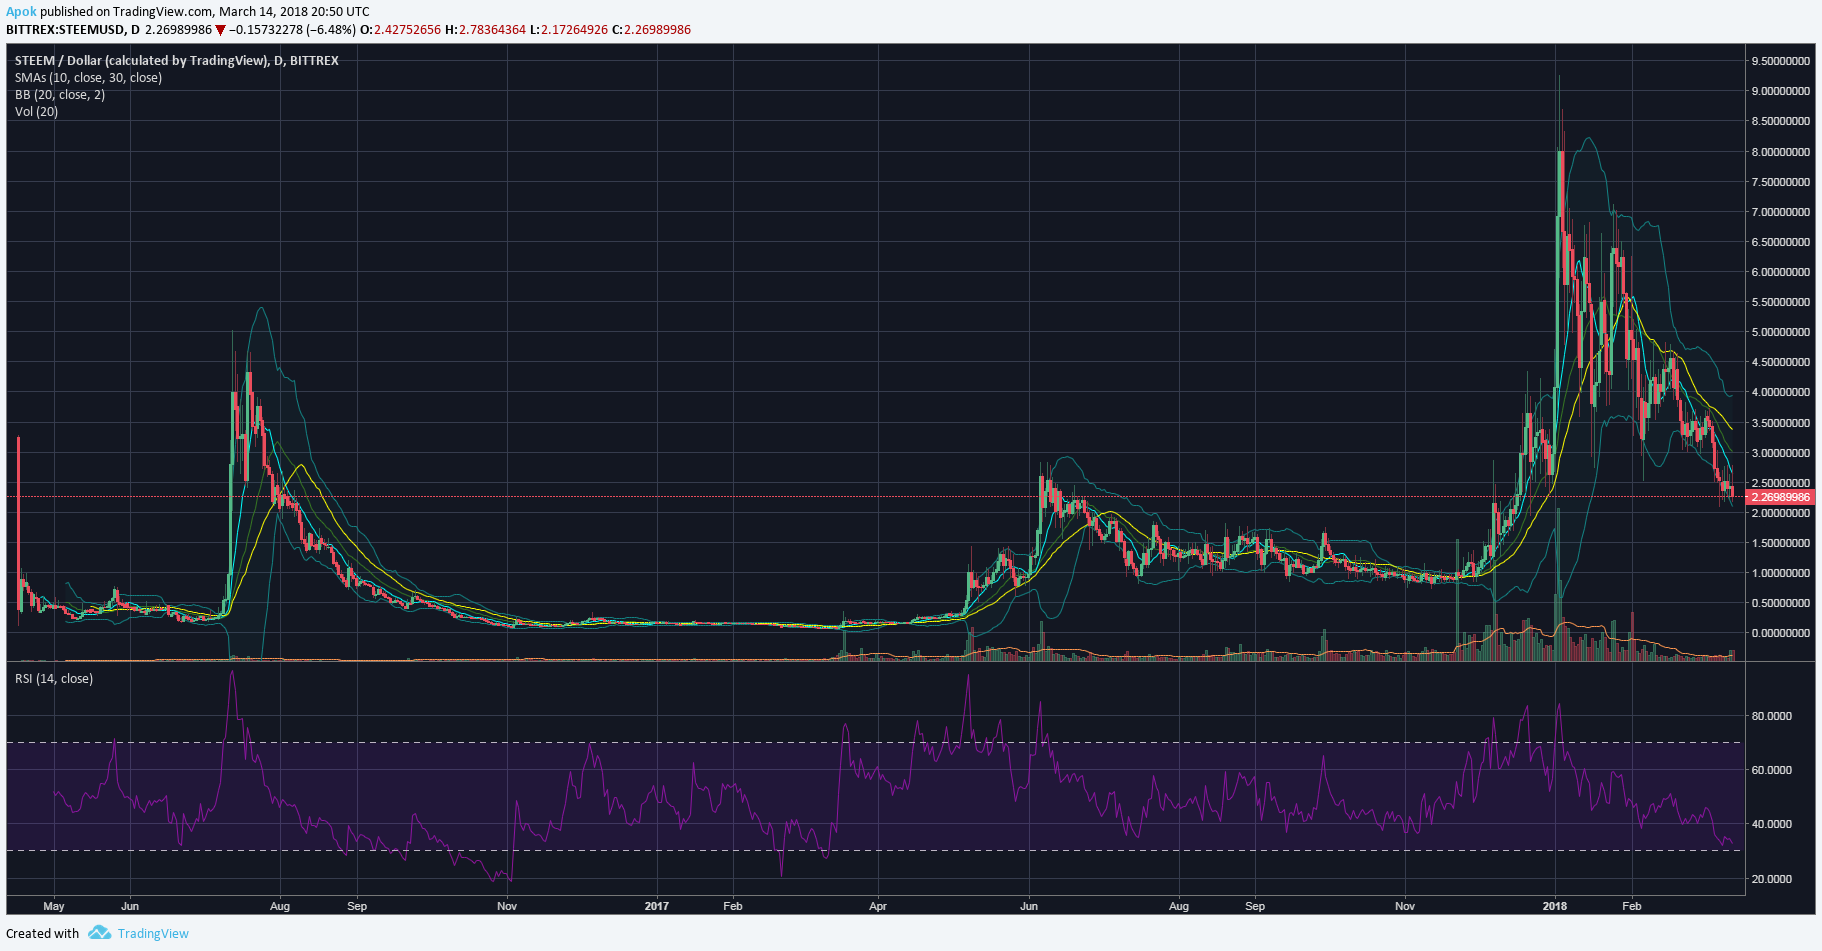
All time perspective...
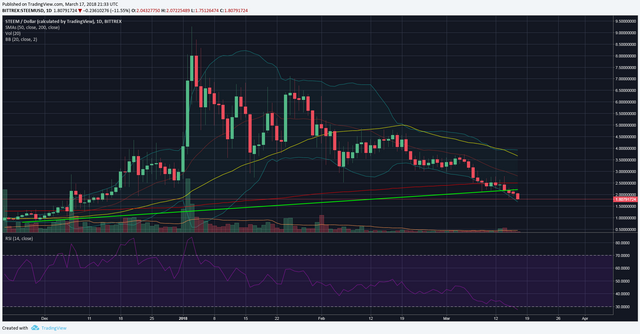
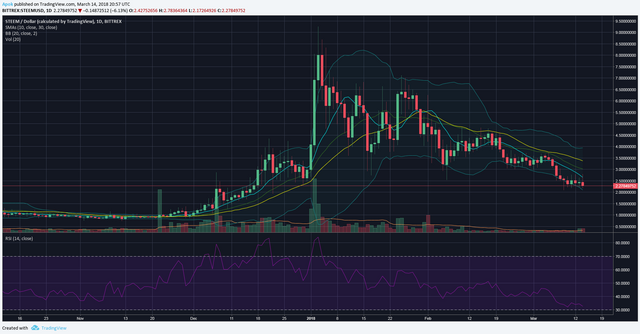
The past 3-4 months of action...
And our recent trendline...

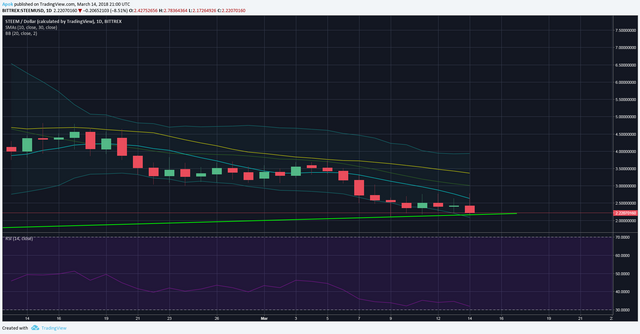
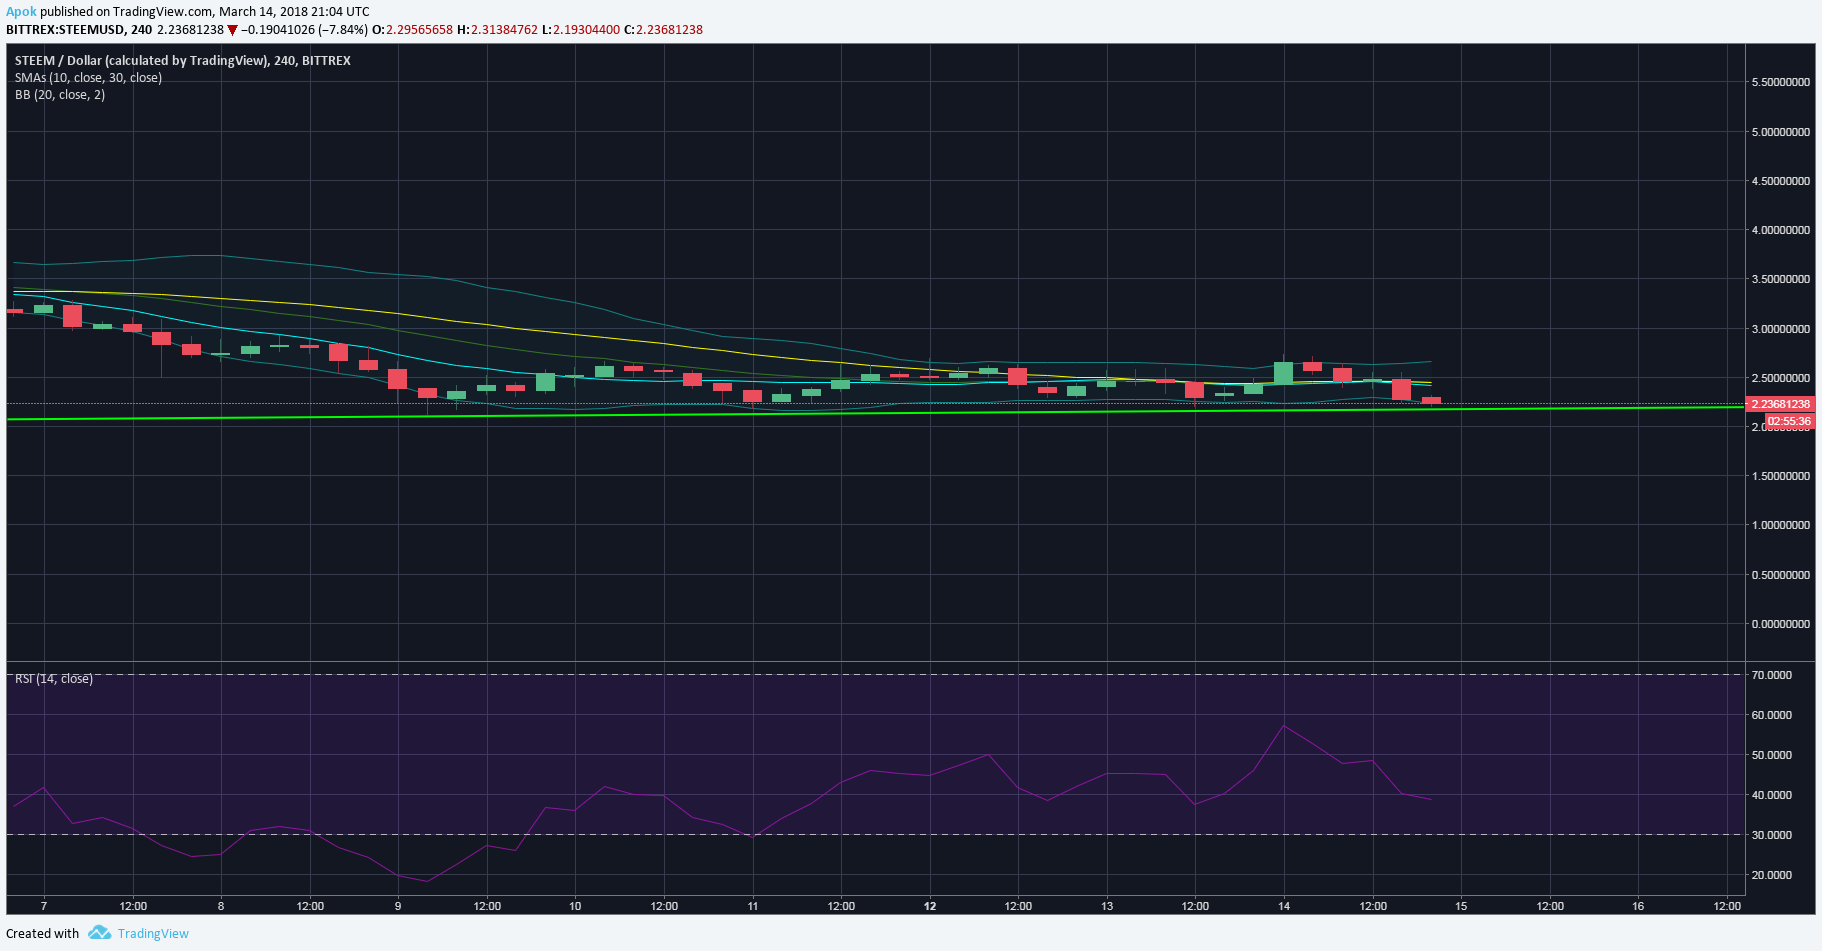
Our RSI indicator is signaling near bottom on our trend line... let's see if this idea holds true
Look how tight everything is in our 4 hour candle perspective...
Allow me to address that this is not financial advice... It is recommended that you do your own due diligence, fundemental and technical analysis before purchasing any asset. I simply enjoy looking at the charts...
Happy trading!
Sort: Trending
[-]
apok (33) 7 years ago