Trading by candlelight
Don’t be left in the dark, view this quick guide on how to read candlestick charts.
Around 1710, a Japanese rice trader named Homma Munehisa discovered that although the price is mostly linked by supply and demand, that the market is strongly influenced by traders’ emotions. This principals is what Homma based the candlestick-chart analysis on, which measures market emotions surroundings stocks. This charting technique has become very popular among traders today.
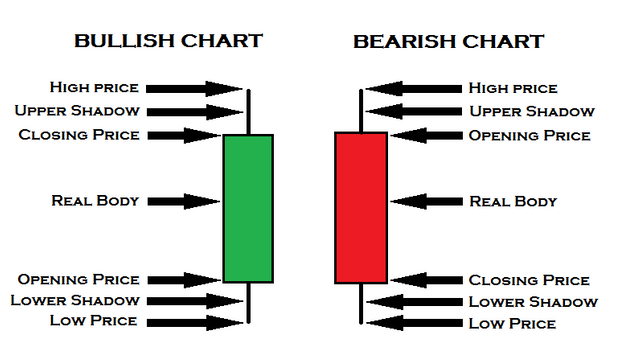
Bullish

Swipes up when attaching
• Optimism
• Price going up
Bearish

Swipes down when attacking
• Pessimism
• Price going down
Candlestick are indicators that helps you identify possible early reveals of how the market is behaving in the current trends, never use this indicator alone, always us it with other popular indicators e.g. Moving Average, Relative Strength Index (RSI), Slow Stochastic, and Moving Average Convergence & Divergence (MACD)
Chart can be viewed in different time charts e.g. weekly, daily, hourly and even minutely depending on traders’ preferred trading strategy.
Candle stick patterns
Doji
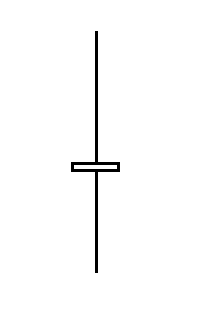
• Open and close the same
• Market is tired
• Market has lost its sense of direction and becomes vulnerable to changes
• Loss of bullish or bearish momentum
• Not reversal signal
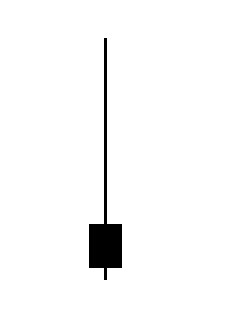
Hammer
• After a preceding downtrend
• Colour of small real body does not matter
• Lower shadow three to four times the size of the real body
• No or small upper momentum
• Loss of bearish momentum
• Bottom reversal signal
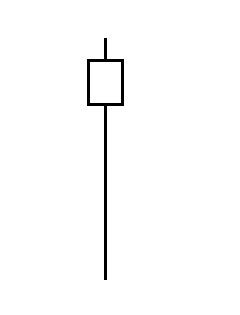
Shooting star
• Warring of possible falling price
• After a preceding uptrend
• Colour of small real body does not matter
• Upper shadow three to four times the size of the real body
• No or small lower shadow
• Loss of bullish momentum
• Top reversal signal
Hanging man
• Bearish candle pattern
• After a preceding uptrend
• Colour of small real body does not matter
• Second filled(red candle close well below the small real body
• Top reversal
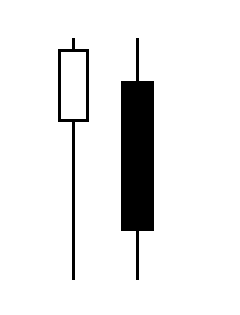
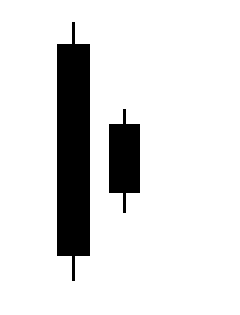
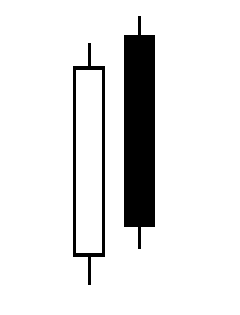
Open close below stomach
• After a preceding uptrend
• Colour of small real body does not matter
• Second candle open and close below 50 % of the long hollow (green) body
• Top reversal signal
• Not for intraday trading
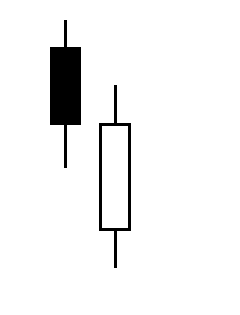
Open close below stomach
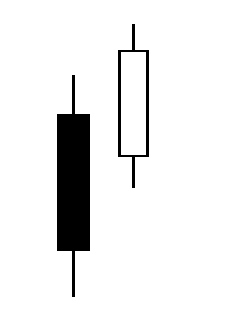
• After a preceding downtrend
• Colour and size of second real body does not matter
• Second candle open and close above 50% of long filled (red) body
• Bottom reversal signal
• Not for intraday trading
Bullish Harami
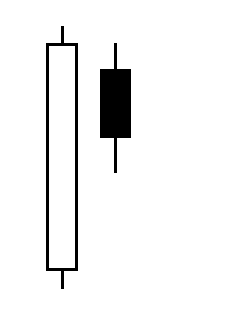
• After a preceding downtrend
• Colour of second body does not matter
• Second body open and close inside the first long filled (red) real body
• Bottom reversal signal
• Not for intraday trading
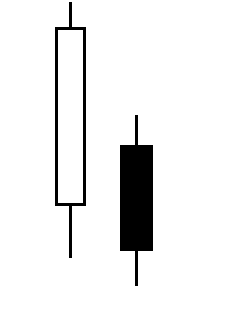
Bearish Harami
• After a preceding uptrend
• Colour of second body does not matter
• Second body open and close inside the first long hollow (green) real body
• Top reversal signal
• Not for intraday trading
Bullish engulfing
• After a preceding downtrend
• Colour of second body does not matter
• Second hollow (green) candle opens below previous day’s close and closes above previous day’s open
• Bottom reversal signal
• Must be different colours
• Indicates that bull taken control of the price movement from the bears
Bearish engulfing

• After a preceding uptrend
• Second filled (red) candle opens above previous day’s close and closes below previous day’s open
• Top reversal signal
• Must be different colours
• Indication of a future bearish trend
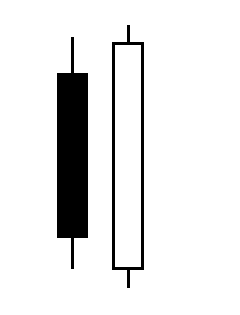
Bullish counter-attack
• After a preceding downtrend
• Second candle opens much lower that previous day’s close and closes near previous day’s close
• Both must be long real bodies and different colours
• Bottom reversal signal
• Not for intraday trading
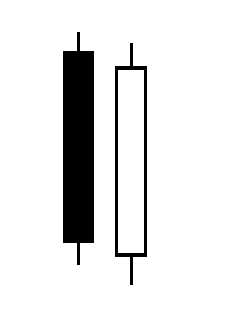
Bearish counter-attack

• After a preceding uptrend
• Second candle opens much higher than previous day’s close and closes near previous day’s close
• Both must be long real bodies and different colours
• Top reversal signal
• Not for intraday trading
Piercing line
• After a preceding downtrend
• Hollow (green) candle opens below previous day’s close and closes above 50% of filled(red) real body
• Bottom reversal signal
• Must be different colours
Dark cloud cover
• After a preceding uptrend
• Filled(red) candle opens above previous day’s close and closes below 50% of hollow(green)
• Top reversal signal
• Must be different colours
Morning Star
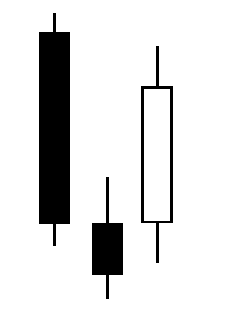
• After a preceding downtrend
• Second real body must be below first and third candle bodies
• Third candle must close above 50% of the first filled (red) real body
• Colour of second small real body does not matter
• Bottom reversal signal
Evening star
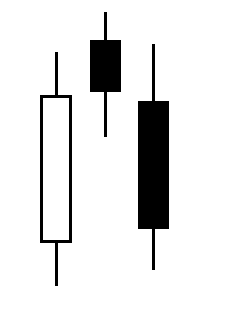
• After a preceding uptrend
• Second real body must be above the first and third candle bodies
• Third candle must close below 50% of the first hollow (green) real body
• Colour of second small real body does not matter
• Top reversal signal
Hi! This is a great post on the basics of candles! Thank you for creating it.
I have been trying to get into day trading and need to learn more about this and other ways to watch the charts and pick up trends.
Would you happen to be able to create a post about what to look for for day trading?
Thank you!
Hi, thank you for the reply, I will be posting a guide on day trading soon.
Awesome! I look forward to it!