Deep Onion - Technical Analysis - 28.01.2018
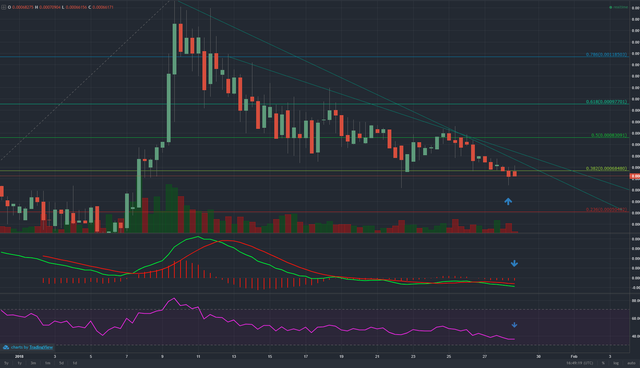
We are in a downtrend, we have our main trendline and we are following it... I'm still surprised on how well Deep Onion has held its ground in this bearish market, at some point I was expecting Deep Onion much lower than where it was at the time. So off to Fibonacci levels, we are at 0.382 level again, testing it, hopefully we won't close below on a daily chart (PS! this is 8-hour chart.) I can see in the order book that we have sell orders from 70k satoshi and up so I think at the end of the day we will close above it and this is just test of 0.382 level. The reason why I'm looking at 8-hour chart is that I don't have clear MACD and RSI the on daily chart. We have to be careful with this one as previous resistance can be current support, and at the same time, previous support can be resistance, so keep your onions tight folks.
As for MACD and RSI. We can see that we had a MACD crossover but with RSI slowly going horizontal and if we close above 68k satoshi I think that both of these indicators will be pointing upwards and IT could mean end of this downtrend.
With recent changes in bounty rewards, it could stop dumpers from dumping their onions and that could have a positive impact on price as well. :)