Deep Onion - Technical Analysis - 22.01.2018
Hello, good folks,
Here is today's chart.
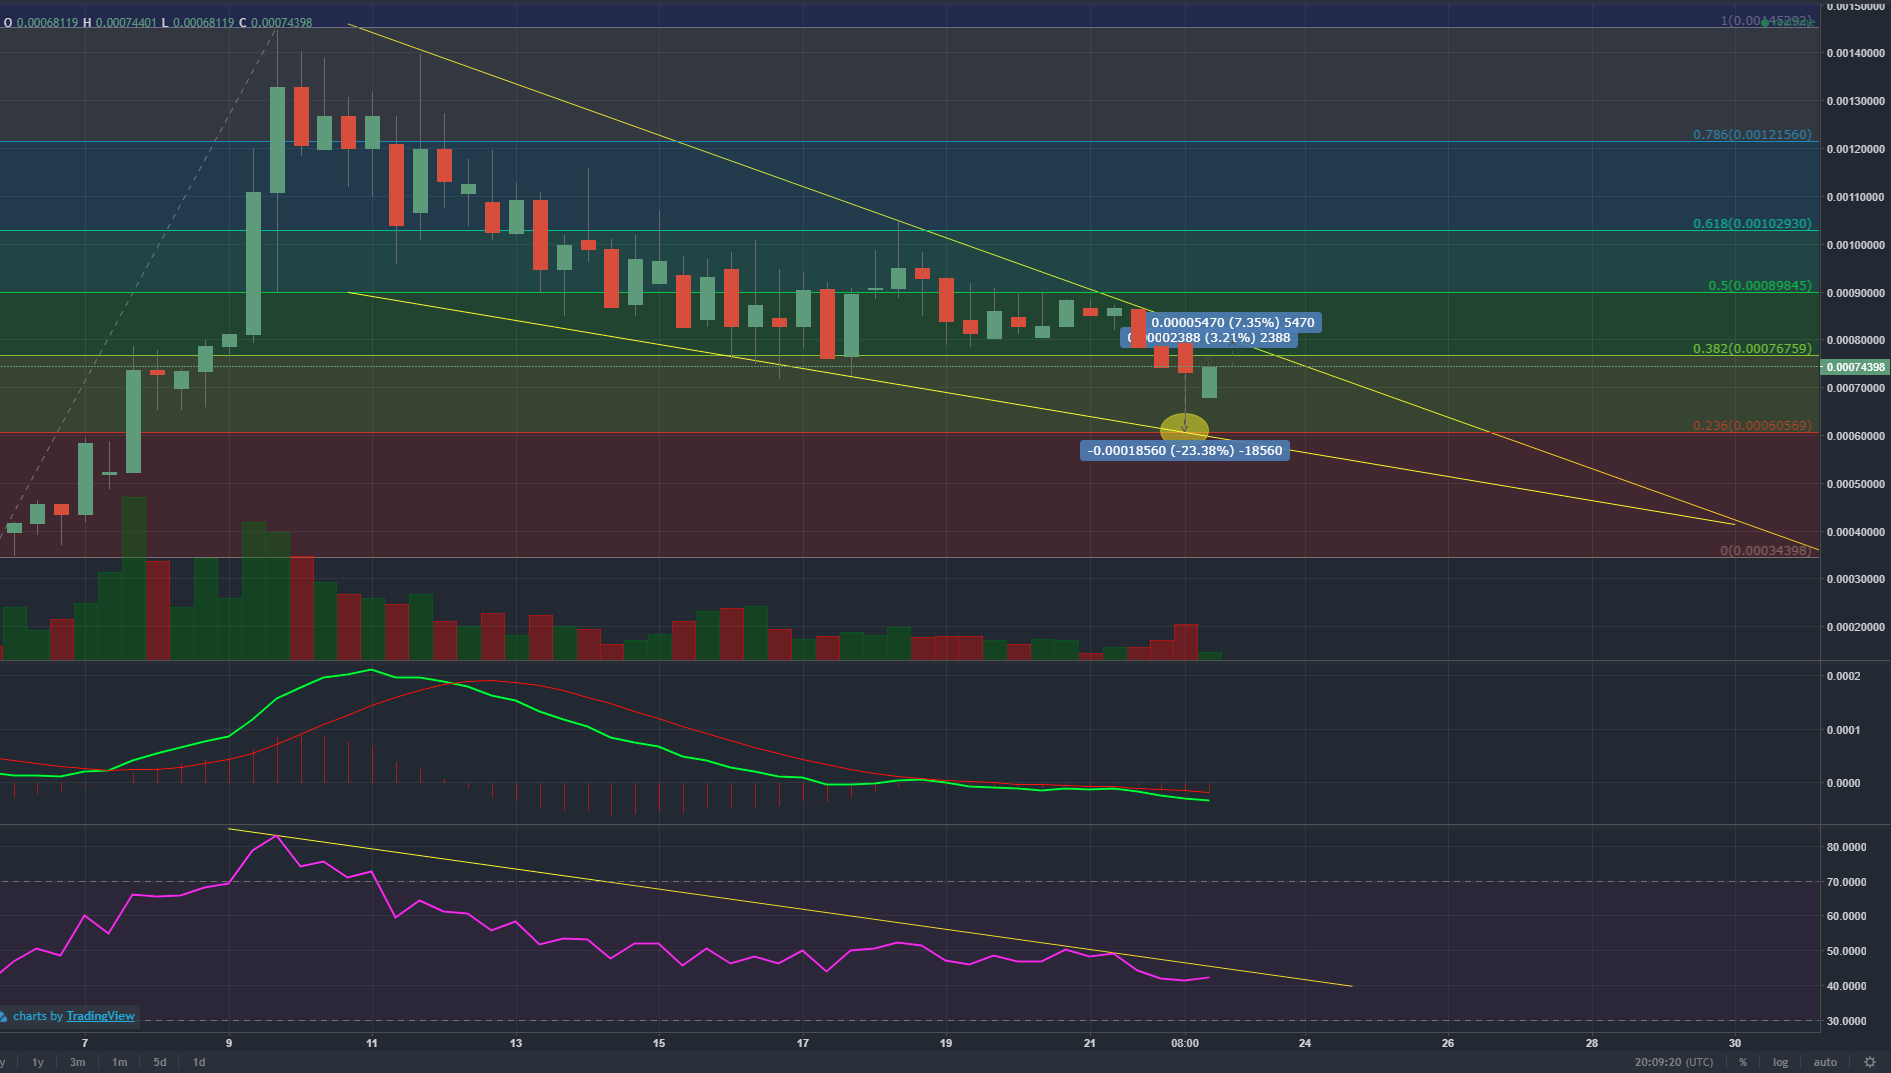
Today was a sad sad day for Deep Onion. I almost shed a tear when I saw my bellowed Deep Onion drop over 23% when it was hanging in there so bravely. It made me go in and re-evaluate my charts and now I see that my previous fib. was kind of wrong... So I drew up a new one and now I can see that we have been in a channel between 0.236 and 0.382 for a while and that we broke it today, downwards. Anyways trough out a day we managed to pull back in, so far we are 3.21% from where we started and 7.35% from down trendline. I'm kind of hoping that we could finish above 0.382 level as it could be enough boost in case market recovers to boost us up and break the current negative trend. PS! this is 8H chart.
MACD lines are still walking together... no crossovers.
RSI is pointing a bit upwards if we break that RSI trendline I could see us breaking negative candlestick trendline too :)
Anyways, hang it there folks! Hodl your onions as there are people out there to get them for a cheap price. Don't let them :)

Do you think that tech analysis is work? In my opinion, there is too low time passed.
I'm trying to use highest time frame possible. Deep Onion have been around much longer but only not on this exchange.