Litecoin (LTC) Long-term Price Analysis
LTCUSD Long-term Trend: Bearish
Distribution territories: $120.00, $140.00, $160.00.
Accumulation territories: $70.00, $50.00, $30.00.
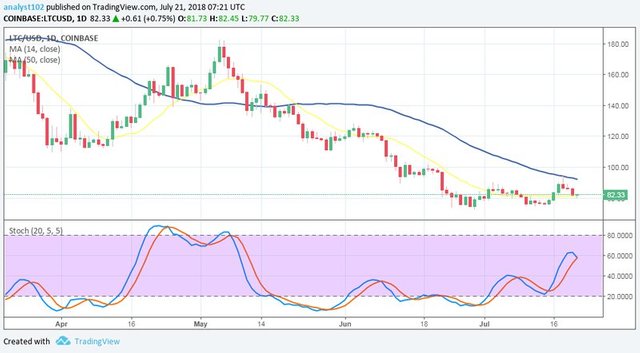
Litecoin has been seeing its price appreciate against the US dollar this week. The bulls pushed the cryptocurrency past its last low of $75,00. On July 15, like many other cryptocurrencies, LTC also saw the emergence of a short bullish Japanese candlestick.

LTC’s value rose steadily on July 16 and 17. The cryptocurrency’s price briefly touched the 50-day SMA from below on July 18, and later on, started reversing until now. The action that took place on July 16 broke the 14-day SMA, and its Japanese candlestick bottom line at $78.00 now stands as one of the pivotal price points that seems to be able to hold as a support.
The 50-day SMA is located above the 14-day SMA. The Stochastic Oscillators have moved northwards a bit past range 60, and now faintly point north-east. This shows precautionary entries show be taken. The sudden rise in the market value of LTC still seems to be under pressure as the bulls haven’t been able to break past the two SMAs.
In fact, the bulls need to build up strength to have a better chance to influence the market. Long entry positions should be looked out for a while as traders take proper precautions.
The views and opinions expressed here do not reflect that of CryptoGlobe.com and do not constitute financial advice. Always do your own research.

What Abra Thinks About Some of the Most Popular Altcoins (ETH, LTC, XRP, XLM, DASH, QTUM, NEO, ZEC)
What Abra Thinks About Some of the Most Popular Altcoins (ETH, LTC, XRP, XLM, DASH, QTUM, NEO, ZEC)
What Abra Thinks About Some of the Most Popular Altcoins (ETH, LTC, XRP, XLM, DASH, QTUM, NEO, ZEC)
What Abra Thinks About Some of the Most Popular Altcoins (ETH, LTC, XRP, XLM, DASH, QTUM, NEO, ZEC)
What Abra Thinks About Some of the Most Popular Altcoins (ETH, LTC, XRP, XLM, DASH, QTUM, NEO, ZEC)
What Abra Thinks About Some of the Most Popular Altcoins (ETH, LTC, XRP, XLM, DASH, QTUM, NEO, ZEC)
What Abra Thinks About Some of the Most Popular Altcoins (ETH, LTC, XRP, XLM, DASH, QTUM, NEO, ZEC)
What Abra Thinks About Some of the Most Popular Altcoins (ETH, LTC, XRP, XLM, DASH, QTUM, NEO, ZEC)
What Abra Thinks About Some of the Most Popular Altcoins (ETH, LTC, XRP, XLM, DASH, QTUM, NEO, ZEC)
What Abra Thinks About Some of the Most Popular Altcoins (ETH, LTC, XRP, XLM, DASH, QTUM, NEO, ZEC)