Trading Steem with Elliott Wave Theory
Hello everyone! I hope you will be good. Today I am here to participate in the contest of Steemit Crypto Academy about the Trading Steem with the Elliott Wave Theory. It is really an interesting and knowledgeable contest. There is a lot to explore. If you want to join then:
Eliot Wave Theory is of great importance in the crypto trading. It was developed by Ralph Nelson Elliott in 1930s. This theory is based upon the idea that the market moves with the predictable patterns or waves. And these waves and the patterns tell us about the sentiments of the market. It tells us that the market moves in repetitive cycles which appear by the influence of the investors.

Question 1: Describe the Five Impulsive Waves of Elliott Wave Theory
Explain the characteristics of the five impulsive waves in the Elliott Wave Theory and the key criteria that differentiate impulsive waves from corrective waves. Use the STEEM/USDT trading pair as an example to illustrate your explanation.
Elliott wave theory suggests us that the market moves in cycles. And these cycles can be broken down into two major waves. These two types are impulsive waves and corrective waves. Impulsive waves are the movements in the direction of overall trend. Corrective waves are the counter trend movements.
According to the Elliot Wave Theory the impulsive waves consists of 5 distinct waves. Here are the characteristics of these 5 impulsive waves:
Wave 1
This wave is the initial movement of the market in the direction of the current trend. It starts often after the end of the corrective phase.
Psychology: Investor sentiment is still quite cautious. Because the market is recovering from a bottom or previous decline.
STEEM/USDT Example: If STEEM has been in a long downtrend then wave 1 could be a small upward move. It happens most probably with the positive news or a slight change in market sentiment.
Wave 2
This is a corrective wave and it moves against the wave 1. And this wave comes down from the of the first wave again. And it usually does not retrace more than 100% of wave 1.
Psychology: The investors start taking profit. They think that the upward movement is just a temporary correction in the bear market.
STEEM/USDT Example: After the initial upward movement in STEEM the wave 2 could see a partial retracement. But it would not fall below the start of wave 1.If STEEM has been in a long downtrend then wave 1 could be a small upward move. It happens most probably with the positive news or a slight change in market sentiment.
Wave 3
This wave is the strongest as well as longest wave in the impulsive sequence of waves. It moves above the peak of the wave 1. And strong momentum and increased participation by the traders drive this wave. They recognize the early uptrend.
Psychology: During this wave the investors become confident about the trend. And seeing the momentum many traders jump in the the trades and it cause pushing the prices more in upward direction.
STEEM/USDT Example: The price of STEEM can significantly go up during Wave 3. Trading volume of steem will also be increased. In this wave STEEM can break through important resistance levels.
Wave 4
This wave 4 is another corrective wave after wave 3. This wave move against the wave 3. But this corrective wave is typically short and less deep than wave 2. Here wave 4 does not overlap with the wave 1 it means that the price will not go down to the area of first wave.
Psychology:As we know that the wave 3 is the strongest and the longest wave and here the price increases a lot. So taking the opportunity investors take profit in wave 4. But the trend still remains continuous.
STEEM/USDT Example: STEEM may pull back slightly from its Wave 3 highs. But it will not fall too far because the traders starts contributing another rally.
Wave 5
This is the final impulsive wave in a trend. It is actually the last push towards uptrend. It can be a strong wave. And it is often marked by using the divergence technical indicators such as RSI or MACD. They show that momentum of the price movement is becoming weak.
Psychology: In this wave there is excitement in the market. And the latecomers push the prices more higher by buying the assets. But the smart investors pull out their investments and take profit.
STEEM/USDT Example: Actually the price of Steem can further go upward in the wave 5. But the momentum indicators show divergence such as they show higher price but lower RSI and it shows that the upward rally is losing its strength.
Key Criteria that Differentiate Impulsive Waves from Corrective Waves
Direction of Movement: Impulsive waves specifically 1, 3, and 5 move in the direction of the larger trend. While the corrective waves 2 and 4 move against it.
Structure: Impulsive waves follow a 5-wave structure with three waves in the trend direction and two against the trend direction. On the other hand corrective waves usually follow a 3-wave structure.
Strength and Momentum: Impulsive waves especially wave 3 tend to have stronger momentum with higher trading volumes. Corrective waves often show lower volumes and less momentum.
Wave Relationships: Waves 2 and 4 are corrective waves within the 5-wave impulsive sequence. And they usually follow Fibonacci retracement levels. I we look more closely Wave 2 commonly retraces 50%-61.8% of Wave 1 while Wave 4 often retraces 38.2% of Wave 3.
STEEM/USDT Example Summary:
If STEEM enters an impulsive uptrend against USDT the price movement may go in a 5-wave pattern:
- A small upward movement (Wave 1),
- A pullback (Wave 2),
- A strong rally (Wave 3),
- A shallow retracement (Wave 4), and
- Another rally (Wave 5) before eventually correcting.
This pattern can help the traders to identify entry points during corrective waves and potential profit-taking zones during impulsive waves.
Question 2: Identify Impulsive and Corrective Waves on a Steem Chart
Using a historical Steem price chart, identify the impulsive and corrective waves over a given period. Explain why certain waves are impulsive and others corrective. For this analysis, use a daily or weekly time frame.
In order to find the 5 impulsive Waves of any token it is necessary to look at the 5 distinct price swings in the direction of the main trend as per the requirements. And these price swings should alternate upward and downward.
Then we have to label these waves as 1, 2, 3, 4 and 5 to detect the impulsive sequence. From these 5 waves the odd waves 1, 2, and 3 are the impulsive waves which drive the price upward. And the even waves 2 and 4 are the corrective waves which drives the price downward.
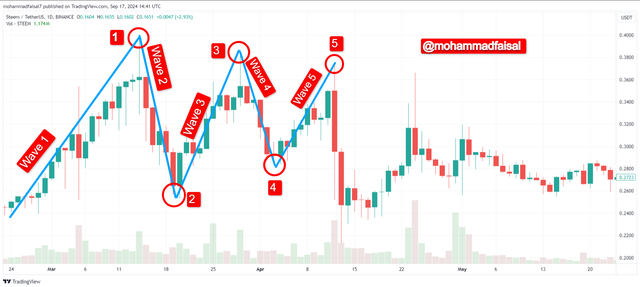
Wave 1 (Impulsive): STEEM rallies from $0.24 to approximately $0.40 in the time period of 2 weeks. This waves marked the first upward movement after the prolonged downtrend. It is the 1st impulsive wave.
Wave 2 (Corrective): In this wave 2 the price of STEEM pulls back to approximately $0.26. In this wave the pull back is moderate and it did not go below than the previous level of $0.24 from where the wave 1 started to rise upward. And this 2nd wave is a corrective wave because the market takes correction in this wave.
Wave 3 (Impulsive): In this wave the price of STEEM again surged from $0.24 to $0.3969. It got a good momentum in the upward rally. And the trading volume of STEEM was increased significantly as we can see in the price chart of STEEM. So it was another impulsive wave after the wave 2 according to the Elliott Wave Theory.
Wave 4 (Corrective): In this wave 4 the price of STEEM was corrected to $0.2884 level. It was a small pullback of price as compared to the wave 2 which was also a corrective wave. And it did not go down from the start of the wave 3.
Wave 5 (Impulsive): In the wave 5 STEEM token makes a final push towards the increase in the price. The price increases aain as we can see the wave 5 move upward in the bullish trend. In the wave 5 STEEM touch its high of $0.3741.
Why Some Waves are Impulsive and Some are Corrective
In the Elliott Wave Theory the waves are distributed to impulsive as well as corrective based on their trend and structure of price movement.
Impulsive Waves
Some waves are directed as impulsive waves because they move in the direction of the primary trend. These waves push the price in the trend direction whether it is bullish or bearish. They are specified by:
Movement in the direction of larger trend: In an uptrend the impulsive waves move in an upward direction and in the downtrend impulsive waves are the downtrend movements.
Strong Momentum: Impulsive waves have strong momentum to drive the primary trend. They show higher volumes and they dominate in the market whether it is a buying pressure in uptrend or a selling pressure in downtrend movement.
Five Wave Structure: The impulsive phase consists of 5 waves. There are 3 impulsive waves and 2 are the corrective waves. And each impulsive wave push the price in the primary trend.
Corrective Waves
Corrective waves are those waves that go against the primary trend. If the market price is going up but the corrective waves will go down opposing the primary trend of the market. Corrective waves are characterized by:
Movement against the larger trend: In an uptrend the corrective waves are the downward movements. We can say wave 2 and 4 are the corrective waves because they move against the primary trend. And similarly in a downtrend corrective waves are the upward waves they drive the price to upward direction.
Weaker Momentum: Correctives waves have low trading volume. These waves are the short term waves in any trend. This reflects a temporary reduction in the buying or selling pressure.
Three Wave Structure: Corrective waves usually follow a 3 wave pattern. We denote these waves by A, B, and C. They can be complex but they are always against the basic trend.
This difference between the impulsive and corrective waves help us to identify the current phase of the market. We can determine our entry as well as exit points.
Question 3: Explain the Alternation Rule in Corrective Waves
Discuss how the alternation rule applies to corrective waves in Elliott Wave Theory. How could this rule influence a trading strategy for the Steem token? Provide an example of a complex correction versus a simple correction using a Steem chart.
The Alternation Rule indicates that in the Elliott Wave Theory when two corrective waves appear consecutively they are directed to take on different corrective patterns such as movement of waves 2 and 4 in an impulsive wave sequence.
For Example: If the wave 2 is a sharp correction wave then the wave 4 will be more sideways or complex. This rule helps the traders to determine the upcoming corrective wave based on the nature of the previous one.
Types of Corrective Waves
Generally there are two types of the corrective waves:
Simple Correction: In the simple correction waves form a zigzag pattern. In this zigzag pattern wave A is an impulsive wave and wave B is a corrective wave and the wave C is again impulsive wave. Simple corrections are sharp and these waves retrace the preceding waves quickly.
Complex Correction: Complex corrections form different patterns such as flat, triangles, double or triple zigzags. These corrections are more sideways. And these corrections take more time to be held. And these waves become frustrating for the traders. And these are generally unpredictable.
How the Alternation Rule Applies
According to the Elliott Wave Theory in a 5 wave impulsive sequence the corrective waves 2 and 4 alternate with each other. There are 2 cases for the rules of the alternation of the corrective waves which are given below:
CASE - I: If the correction of the wave 2 is sharp and deep then the correction of the wave 4 will be sideways. Wave 2 retraces a large portion of wave 1.
CASE - II: If the correction of the wave 2 is complex and sideways then wave 4 will be sharp. The correction of the wave 4 will be sudden and straightforward correction.
This alternation helps the traders to maintain the balance of the market psychology. Traders can guess the next movement and the start of the impulsive wave with the help of the alternation rules.
Impact on Trading Strategy for the Steem Token
If we understand the alternation rule it can significantly improve the trading strategy for STEEM/USDT. So while trading STEEM token we can adjust our trading strategy according to the correction of the waves.
Wave 2 is Sharp (Simple Correction): If we observe a sharp correction in wave 2 wile analyzing or trading STEEM then we can expect that the next correction of wave 4 will be more complex. And this correction will be sideways. And it needs more period for the consolidation.
Strategy: After the sharp correction of wave 2 we should look for the strong entry at the end of the correction. If we spot the good entry at the end of the correction of wave 2 then we can make handsome profit. Because the wave 3 is the bullish wave after the correction of wave 2.
Wave 2 is Sideways (Complex Correction): If the wave 2 in the STEEM chart is complex and it causes long correction then we can expect that the wave 4 will be simple and sharp than the wave 2.
Strategy: During this complex wave 2 we should be cautious and vigilant because the price movement is very boring for the traders. And after this wave new wave 3 starts and it is an upward wave. As soon as wave 3 finishes another corrective wave 4 begins. It is a sharp correction. And it provides an opportunity to take entry in the market to gain some profit in the wave 5.
Example of a Complex Correction vs. Simple Correction on a Steem Chart
As we have discussed earlier about simple correction and complex correction that if the wave 2 forms a sharp correction in the Elliott Wave Theory then the wave 4 will be more sideways and ultimately it will be a complex correction.
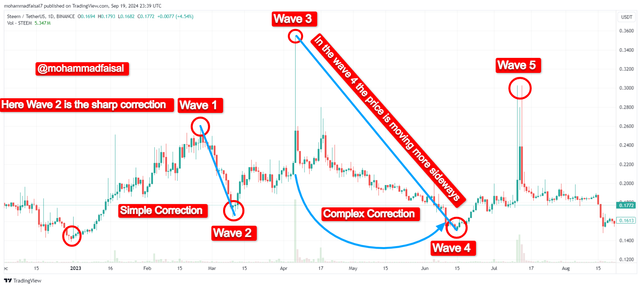
In the above STEEM price chart I have spotted simple and as well as complex correction correction. According to this chart:
The wave 1 started from the price level of $0.1384 and it was an impulsive wave. This wave drove the price upward to the level of $0.26.
Then the wave 2 started. It was a corrective wave. It starts correcting the market from the end of the wave 1. It was a sharp correction. And it retraced the wave 1 up to $0.1649. And this wave did not form complex downtrend. So it was the simple correction of the STEEM which can be seen on the cart.
This simple correction in wave 2 will lead to alternation in the wave 4 in the form of a complex correction.
According to the rules of Elliott Wave Theory if the wave 2 correction is sharp then the correction of the wave 4 is sideways and complex to trade. It take a lot of time for the consolidation and correction. So according to this:
The corrective wave 4 started correction from $0.3545. It was the peak level which was drove by the impulsive wave 3. This correction was very slow and long term. And the price moved sideways all the time during this correction.
Wave 4 was very boring of the STEEM price chart and it took a lot of time for the consolidation and next upward move. It made a flat pattern of the price movement.
Complex correction of wave 4 led to correct the market up to $0.15. Ans this complexity in the correction happened because of the alternation rule which say that if the correction of the wave 2 is sharp then the correction of the wave 4 will be complex.
Question 4: Plot a Trading Scenario for Steem Based on Elliott Waves
Using a technical analysis platform like TradingView , plot a trading scenario for Steem based on a complete formation of the 1-2-3-4-5 impulse waves followed by an ABC correction. What would be your strategy for entering and exiting trades during each wave? Include Fibonacci levels for your entry/exit points.
I have chosen Daily time frame for the analysis of STEEM/USDT pair using TradingView. This time frame starts from February 20, 2024 and at th eend of the corrective wave C it end with May 15, 2024. In the daily time frame a complete wave of 5 impulsive waves (1, 2, 3, 4, 5) and with 3 correction waves (A, B, C) took around 3 months of duration. It was not an easy job to detect the consecutive impulsive waves followed by the corrective waves. Here I have plot the complete chart for trading STEEM/USDT using Elliott Wave Theory and Fibonacci levels.
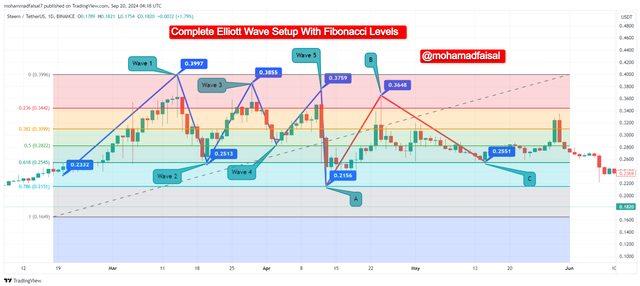
Metadata for the Chart Understanding
- Wave 1, Wave 2, Wave 3, Wave 4 and Wave 5 are representing the consecutive 5 impulsive waves.
- Blue lines are representing the trend lines.
- A, B, C are representing the correction waves after the impulsive waves.
- Blue boxes are representing the prices at that specific points.
- Different colourful lines are representing the Fibonacci levels.
Trading Strategy of Entry and Exit Points During Each Wave
I will try to explain it step by step for the better understanding. Here is how we can approach each wave including its entry and exit points and how to use Fibonacci levels to take decisions:
Wave 1: Initial Impulse
Formation: The wave 1 is the first upward move after the long previous downtrend. This wave 1 occurs after the complete consolidation and accumulation. Here the market starts rising up. But the this wave 1 does not guarantee of a new trend.
Fibonacci Level: As this is the starting wave the fibonacci retracement levels will not apply here. Because they are applied to the retracement of a wave from the previous one.
Trading Strategy
Entry: It is hard to identify the wave 1 but if we get this wave 1 after consolidation then we can take entry at the start of this wave. We should wait for the breakout from the resistance level to enter here.
Exit: We should take partial profits in during this wave. But do not take out all of your assets because it is the sign the trend is just starting.
Wave 2: Corrective Wave
Formation: Wave 2 is a corrective wave. It retraces the portion of the wave 1. But keep in mind that it does not retraces it completely. So the trend still continues.
Fibonacci Level: Wave 2 can retrace up to 61.8% of wave 1. By using these levels we can measure the depth of the retracement. In the current provided chart wave 2 has retraced the wave 1 from $0.3996 to $0.2545. Here according to the price chart and Fibonacci level the wave 2 has retraced 36.31% of wave 1.
Trading Strategy
Entry: As it is the corrective wave in my opinion it is not a good time time take an entry. We should wait for its retracement. But if you want to take a risky entry then use the 50%-61.8% Fibonacci retracement level to enter the market. Place limit buy orders around these levels.
Exit: As after corrective wave 2 impulsive wave in upward direction starts so you can hold it and can exit your trade at peak level of wave 3. But be cautious that if the fibonacci retracement level reaches below 78.6% then exit your entry because it gestures that the trend has failed.
Wave 3: Strong Impulsive Wave
Formation: Wave 3 is the powerful wave which pushes the price upward. We can see in the above STEEM/USDT chart that the price has been pushed upward. In this wave the momentum of the market in upward direction increases.
Fibonacci Level: Wave 3 can reach up to 261.8% of previous wave 1. In the above chart we can see that the price rose from $0.2513 to $0.3855. Here the Fibonacci level was increased 42.14% than the previous wave 1. It did not prove to be very strong wave but still it was profitable.
Trading Strategy
Entry: If we miss entry in the wave 2 then we should not miss entry here in the wave 3. We can enter at the start of this wave or on the dips during this wave.
Exit: We should take partials profits and we should set a stop loss. Because after this bullish wave there is always a wave 4 which is corrective wave. So as the price moves upward we should trail our stop loss accordingly.
Wave 4: Corrective Wave
Formation: After the strong wave 3 market again corrects itself during this correction wave 4 is formed. But this corrective wave 4 is a light corrective wave. So it is a small corrective wave. And it is a sideways corrective wave than the wave 2. You can see wave 2 is sharp than this wave 4.
Fibonacci Level: We can see that the price moved from $0.3855 to $0.2850. It retraced up to 26.59% of the previous wave.
Trading Strategy
Entry: We can enter at the retracement of the wave 4. This wave provides a second chance to join the trend.
Exit: As it is a corrective wave but if the price moves sideways so if we get a chance that price go up near the wave 3 then we can take out our entry with the profit.
Wave 5: Final Impulsive Wave
Formation: Wave 5 is the last upward movement in the trend before the correction waves A, B and C. It has less momentum than wave 3. And the technical indicators show it as a divergence wave.
Fibonacci Level: It can reach up to 100% or 127% of the level of wave 3. But it is a shorter wave than the wave 3. In the above chart this wave started from the price level of $0.2845 and it ended up at the price of 0.3759. It raised 27.68% from the ending of wave 4.
Trading Strategy
Entry: If we see a strong potential we can take entry here as well. If we get a chance that the market gave us a dip around the correction of the wave 3 then we should take entry to follow the trend.
Exit: As it is the last impulsive wave in the Elliot Wave Theory so we have to exit our trades at the peak level of this wave 5. WE can take help of other indicators like RSI to check the bearish divergence.
The A, B, C Correction
After the 1, 2, 3, 4 and 5 impulsive waves the market enters a correction. It consists of 3 corrective waves A, B, C explanation of these waves with the help of the trading chart of STEEM/USDT is give below :
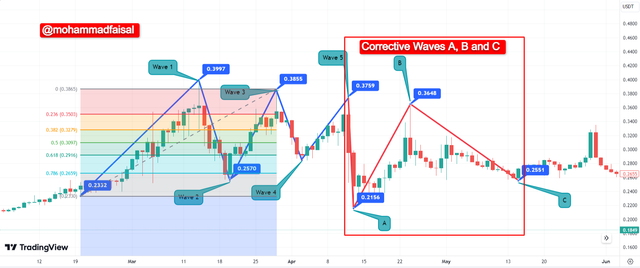
Metadata for the Chart Understanding
- The red box is highlighting the area of A, B, C correction.
- The red trend lines are representing the correction waves.
- Other data was provided in the section before it.
Wave A: Initial Correction
This is the first correction wave after the 5 impulsive waves. This corrective wave make the traders panic and it leads to selling pressure due to which the price falls. In the correction wave A the price fell from $0.3759 to $0.2156. This wave A falls below than the entire setup of the previous 5 impulsive waves. We can see in the chart that the price fell below even from the start of the impulsive wave 1.
Fibonacci Level: As we can see that the price fell from $0.3759 the peak level of the wave 5 to $ $0.2156 lower than the wave 1 startup. It retraced the price up to 54.20%.
Trading Strategy
Entry: We should not take any entry in this corrective wave. Actually start of these waves is the indication of correction and consolidation. So the price will not move up than this level. And it will go down gradually. So do not take any entry to STEEM/USDT during this correction wave A.
Exit: If we do not exit our entry in wave 5 then we should completely our long trades to avoid losses. So while trading STEEM/USDT we can exit our complete long trade.
Wave B: Relief Rally
It is actually a relief rally for the traders. In this wave B the price moves up but less than the peak level of wave 5. It recovers partially from wave A. It is also a trap for the retail traders because they think it can be a resume of the bull market.
Fibonacci Level: Wave B retraces around 50% to 61.8% of the wave A. Here in the above STEEM/USDT chart we can see that the wave B retraced 51.41% from the wave A. This wave is actually the relief for traders to get out of the upcoming downtrend of wave C. I have seen many other examples as well along with STEEM.
Trading Strategy
Entry: Personally I will recommedn to avoid take any entry. If you want to take some risk and profit then you can take a long entry for the scalping only. Otherwise wait to take a short entry to make profit in the downtrend.
Exit: During the wave B all the long trades should be closed.
Wave C: Final Decline
This is the long and last leg of the correction. It is a more decline wave than the wave A. In the above chart we can see that this wave form a long downward move sideways. And we know that currently STEEM is trading around $0.18 and it far lower than the wave A. It is the result of the wave A.
Fibonacci Level: In the above we can see that wave C retraced the price a lot. And if i compare it with the current ongoing price then it has retraced 65.21% of the start of the wave C.
Trading Strategy
Entry: If you want to take an entry then take a short entry after the retracement of wave B.
Exit: I will suggest that continue with your trade until it hits the bottom of the market. And use other indicators like RSI with the Elliott Wave Theory to check if it is showing divergence against the current trend then you can exit your entry with your bags filled with money.
Elliott Wave Theory as well as Fibonacci levels help us to determine the entry and exit points. And we can understand the trend of the market. Understanding of all the waves strengthen our trading experience.
Question 5: Analyze Steem's Current Market Trend Using Elliott Waves
Analyze the current market trend for Steem using Elliott Wave Theory. Where do you think the Steem token is in its wave cycle (impulsive or corrective)? What are the next possible movements? Support your analysis with technical indicators such as the RSI or moving averages.
In order to analyze the current market trend of the STEEM token we need to check the price movement and the technical indicators. We can see price STEEM has risen in the past 24 hours.It shows the slight growth in the price of STEEM.
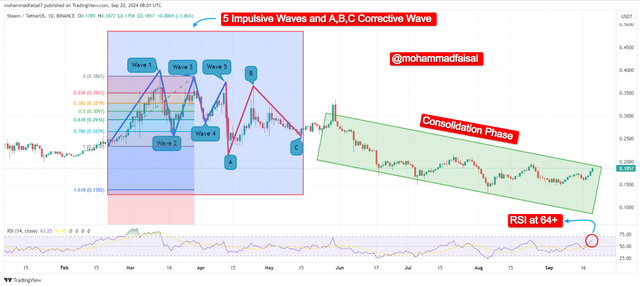
STEEM has recently gone through a complete Elliott Wave Theory setup. We can see the 5 consecutive impulsive waves and then 3 corrective waves A, B and C. And after the correction wave C STEEM is currently in the consolidation phase. The price is moving sideways. It also indicates that the corrective wave is still in progress. These price movements show correction signs because the volume is also low. But if we see in the low time frame we can see an upward movement in the STEEM.
Relative Strength Index (RSI) is currently at 64+. This indicator suggests that the token is approaching an overbought zone. But the overbought zone is not completely here. The value of RSI indicator is representing upward momentum in the market. But when RSI level will reach 70 or above then it is advised that market can start its correction.
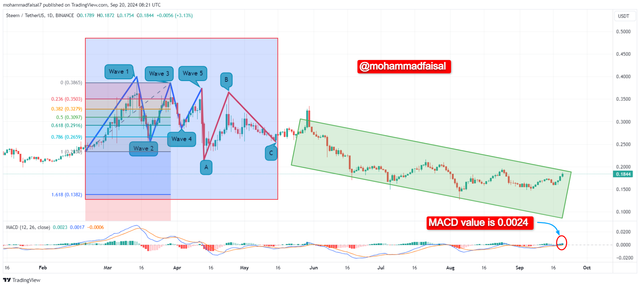
The moving average convergence divergence is indicator is going at the value of 0.0024. This figure of MACD indicates a bullish pattern crossover. And this current trend will continue as long as the MACD line remains above the trend line. When MACD remains in the positive direction it indicates an uptrend.
If we see the effect of both the indicators then we can suggest that STEEM is in the final stages to start an impulsive wave. The consolidation phase will be complete soon. And we can expect a further upward movement. And we can also expect a correction in the market.
Conclusion
Elliott Wave Theory consists of consecutive 5 impulsive waves and then 3 corrective waves. These impulsive waves ad corrective waves are very helpful for the traders to take entry and exit their entries. We can identify the market reversals using the concept of Elliott Wave Theory. In the impulsive waves wave 2 and wave 4 come with alternation. If wave 2 face a sharp correction then wave 4 correction will be sideways and long term by following the alternation. And similarly if corrective wave 2 form sideways correction then the wave 4 will have a sharp correction. WE can sue other technical indicators as well along with the Elliot Wave theory. In this way we can double verify our decision. We can use RSI as well as any Moving Average indicator along with the concept of Elliot Wave Theory.
Disclaimer: All the screenshots have been taken from TradingView and edited by me other used assets are stated.
Hello my dear friend Thank you very much for participating in the contest it is based on a great concept. It is dependent on the investor and a half. looking at Steem through the lens of Elliott Wave Theory, we have impulsive and corrective price waves. Market psychology is reflected by five waves upwards and three waves downwards. Merchants use this theory to analyze past trends of prices to make sound decisions concerning the flows in the market.
Yes exactly the impulsive and corrective waves are used to determine the market sentiments. Thanks for stopping by here and leaving your valuable feedback.
You are welcome.
Great work! Your Elliot Wave specification of STEEM/USDT is very informative! The higher upward impulse in Wave 3 usually brings in more traders who push the prices higher. As you pointed out, Wave 4, which is the correction wave, is usually short and traders are pulling their profits. But the cumulative mode is still the same. Great job! The psychological and technical aspects of the market demand a wonderful presentation!
Thank you for leaving your feedback.
Who would have thought that waves also come with blessings? 😃 One more excellent work from you, my friend @mohammadfaisal.