Cardano diving into the 2nd part of a Cup & handle? (+600% profit potential)
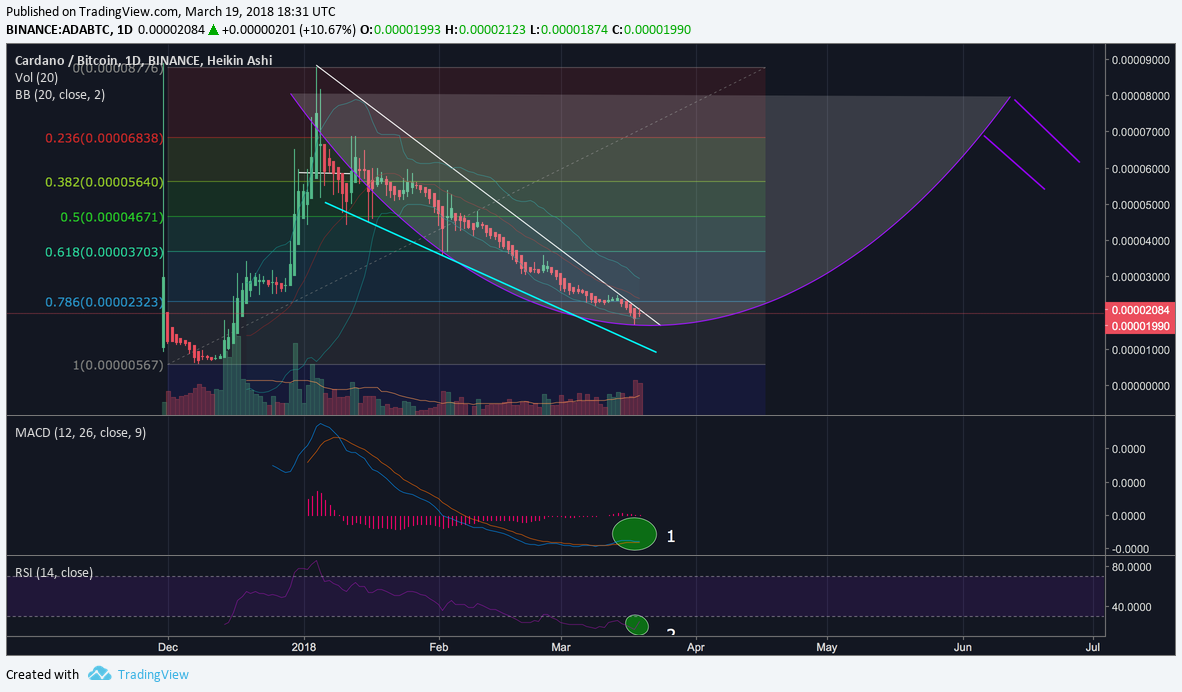
Cardano graph (daily chart)

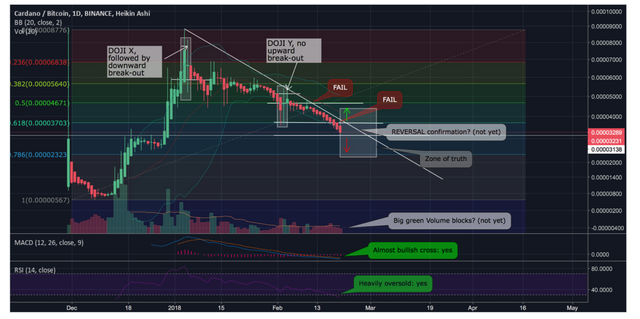
I previously posted about the downtrend of Cardano (on Tradingview) and how & when it would end. The downtrend remained intact (& we know we shouldn’t fight the trend, but wait until there’s a confirmed reversal). Here’s the graph back then:

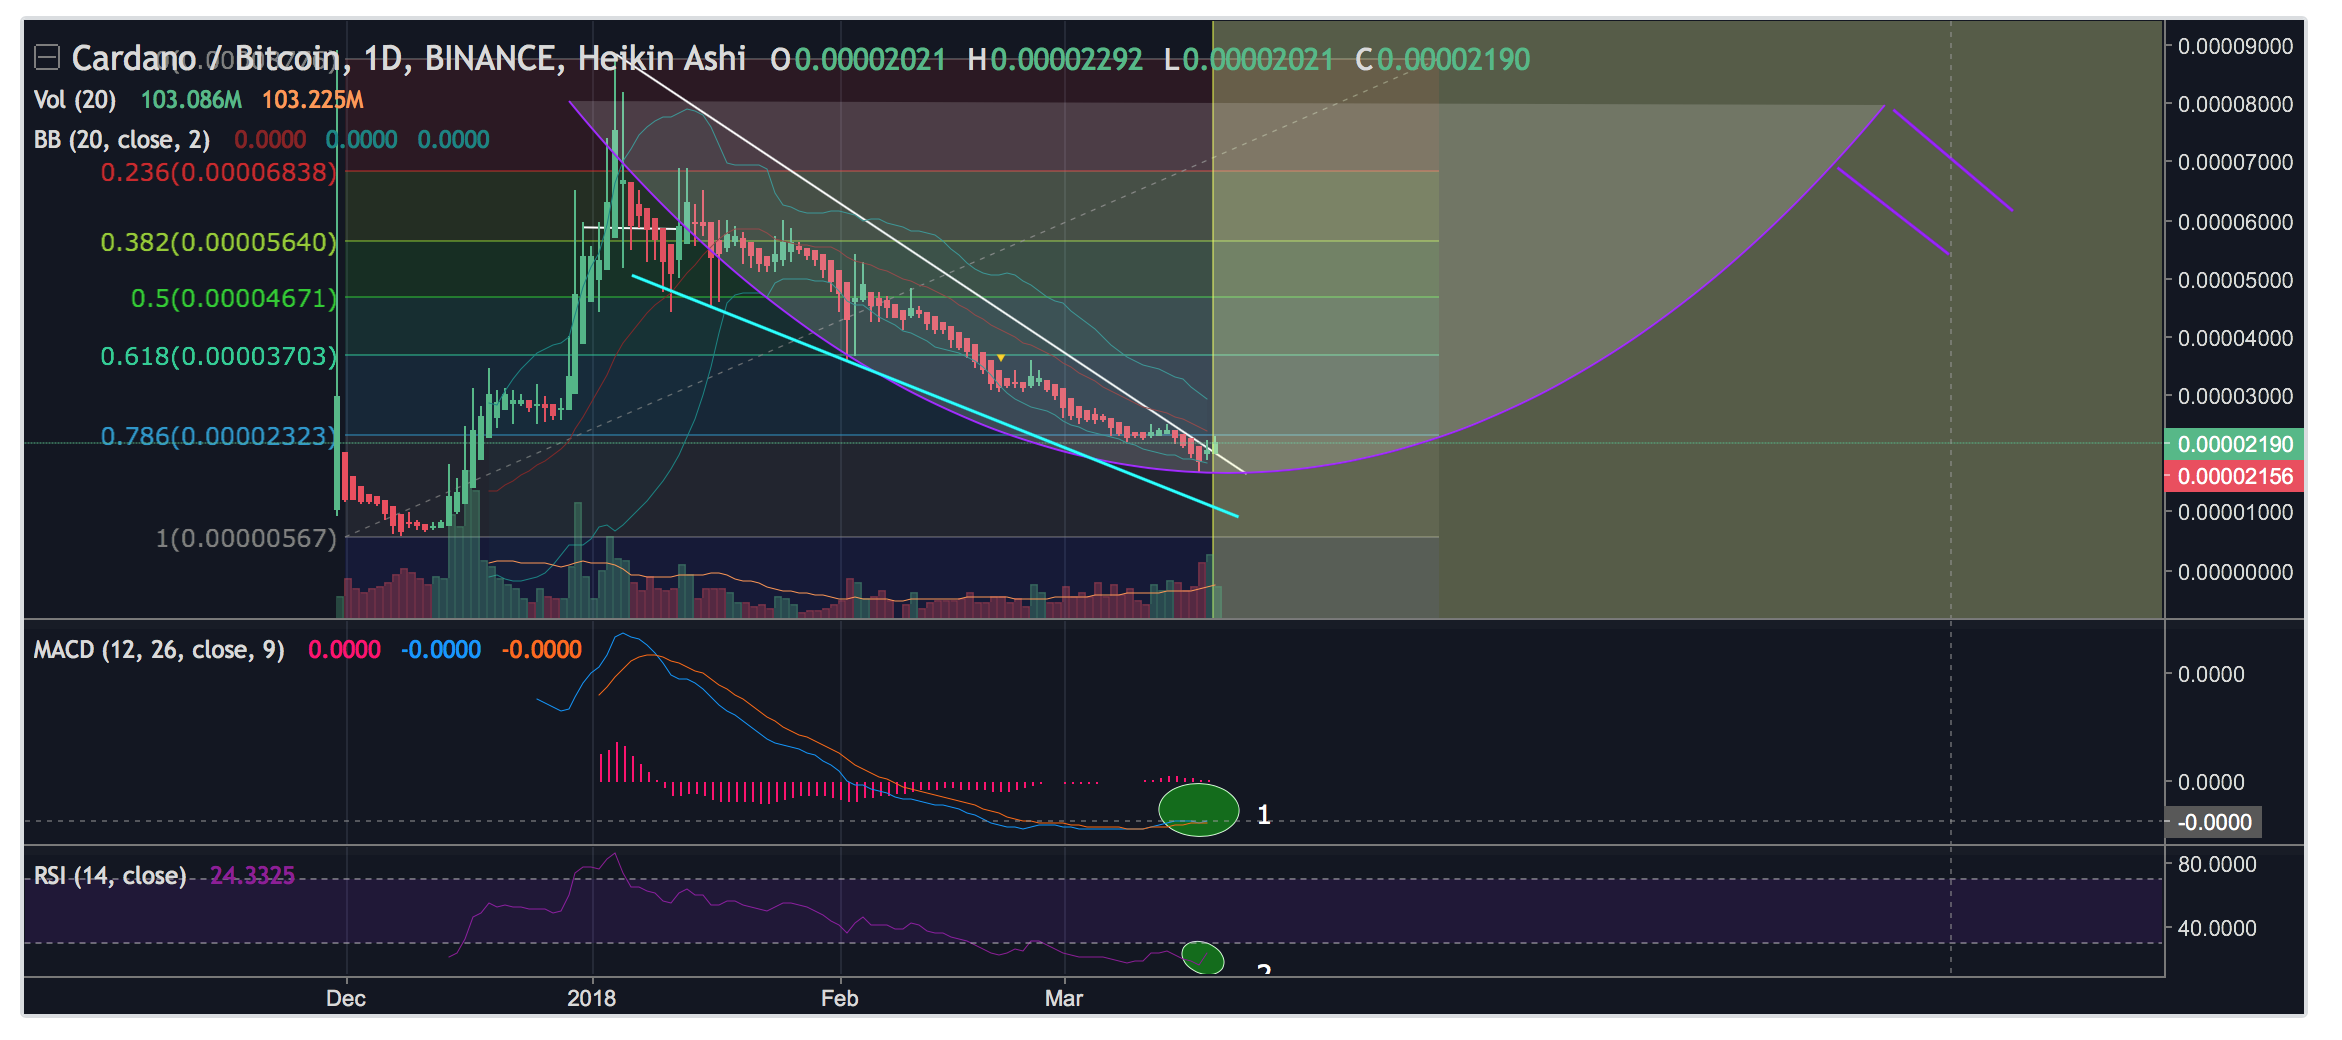
The graph now shows how that downtrend has continued to persist, yet given the likely soon upward curving of the MACD (as you can see quite clearly in the MACD ("1") under the graph, this might bode well for entering the second half of a cup & handle figure. Granted, there might be a bit too much volume to speak of a cup & handle , but I wanted to let the bulls in your head dream a little ;-)

RSI confirms a somewhat more bullish stance in "2" as it is about to get out of the oversold area in turning more inclined to a bull trend. You can clearly see that Cardano at its “ATH” , had the RSI in the exact opposite area, just as with the MACD by the way.
This makes it at least relevant enough to propose it as a possible scenario that Cardano could be going for! ;-)
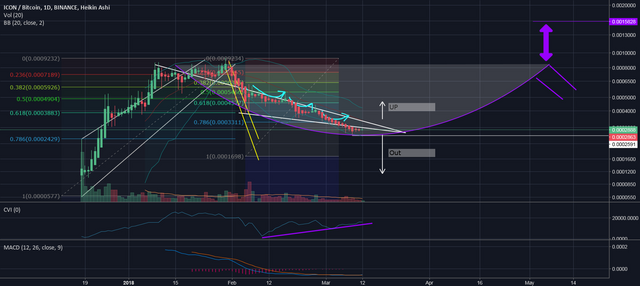
PS: I previously suggested a similar formation for ICX:

Conclusion: if this were to pan out as a cup & handle figure, there lies huge potential in the future price movement for Cardano.
The current retracement implies a potential target of +600% to over 14000 sat.
Let me know what you think? And feel free to like this post if you like the scenario! :-)
PS1: This is ONE of several possible scenarios - I'm just sharing it so we can include it in the ideas list!
PS2: This is not investment advice, DYOR.