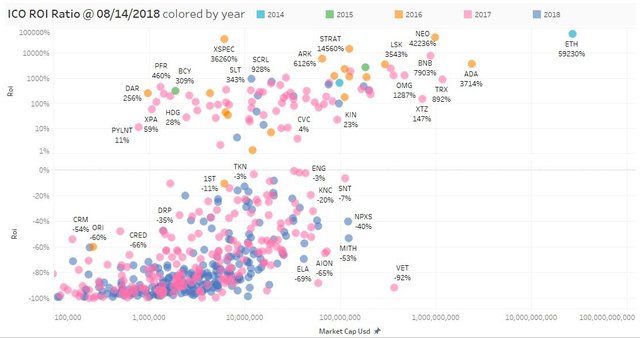
Good recap of ICO returns visualized by year
All of you enjoying good data science, please don't hesitate and follow Cryptokita on Twitter. Recently one fine visual caught my eye in this microblog. Distribution of the dots doesn't look surprising at all: little to no big MCAPs with significant downside + plenty of those loosing 60 percent and more.
This reminds me of one of the recent conference calls I had with a leading US lawyer specializing in crypto and digital assets. This experienced and wise gentleman told me:
"Many claim that crypto industry in similar to venture capital; some even say that TGEs are replacing VCs (in effect, becoming one big community VC fund). I dare to question that: in VC business there is actual venture behind the investment, and founders & investors work jointly to create some business which aims to generate some profit.
With crypto, we currently witness a big crowd of speculative investors who intend to have 10x returns in months or week, and noone speaks about 3-5 year. So it is all about the ultimate goal. And about time horizons."
