XRPUSD - Technical Analysis Novemberr 8, 2017 - Current Price $0.2097

XRPUSD - Day Traders Chart Setup
Moving averages:
Green = 50dma
Red = 200dma
Orange = 9ema
Black = 20ema
I want to look at ripple on the day traders time frame with an upcoming Interledger.io conference in San Francisco tomorrow.
Ripple is considered the anti-thesis of decentralized currency, but if we are honest with each other, we all know everyone is participating and investing in the future, for financial gain.
What are we looking for? Perhaps some fundamental news or insight with the coming conferences and end of 2017 wrap up. A fundamental driver could change the entire chart, but we are looking for signs of life.
Daily
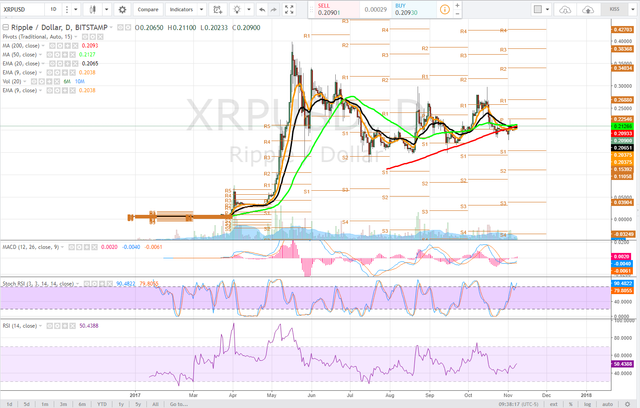
On the daily time frame ripple has been in an extremely long period of consolidation, literally dead money for weeks - But make no mistake, this is a classic bull flag formation and traders and investors should be looking for an extreme move as the consolidation range continues to tighten.
A wedge could also be drawn. Looking at the convergence of moving averages, the first step for bulls is getting the 9ema and 20ema back above the 200dma - this would be very bullish for the price and drive another test of the daily pivot approximately $0.22. This time bulls would like to see this level break and be turned into support.
The stochastic RSI has pushed into uptrend and as we can observe a longer-term trend and support range in the RSI, it has yet again bounced off of the 50 level. The MACD has stabilized on this time frame, producing a bullish cross and I would be interested to see the momentum trend higher to the zero line.

4 hour
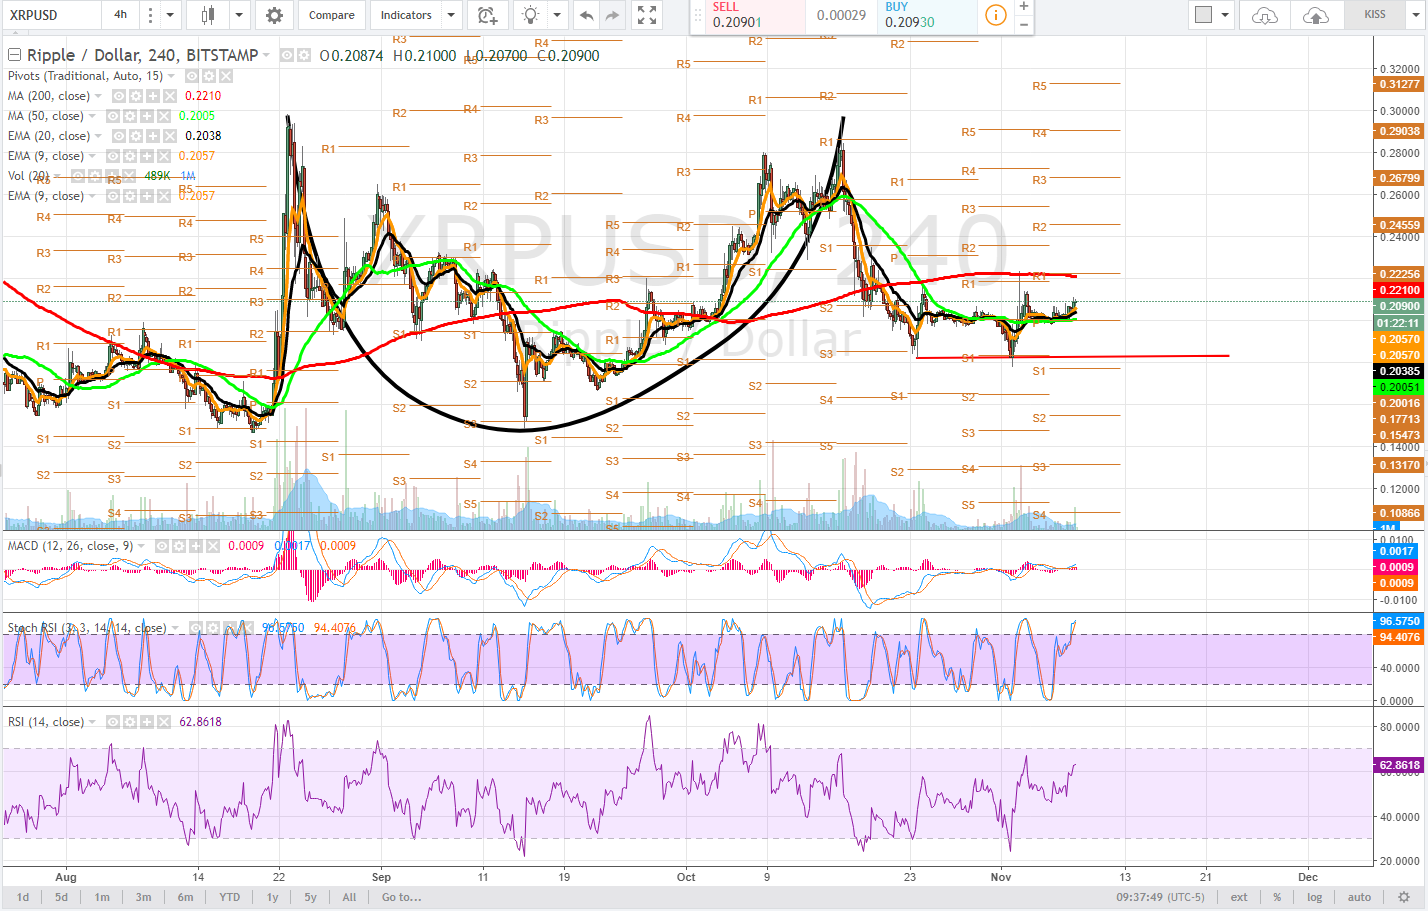
On the 4 hour time frame we may have what appears to be a giant cup and handle formation, or cupping. Typically this is retrace of a steep decline with some sort of steady contour. After the previous high is reached a downtrend & accumulation phase begins, assuming there is a fundamental reason to be bullish on the analyzed asset.
Aclear area of support, $0.201 has allowed the price to bounce twice and is a pivot point.
We are watching the curl in moving averages yet again, the 9 and 20ema are steadily climbing above the 50dma. The 50dma has nearly flatlined, as the ticker movements become less the range tightens and more likely that continuing to track sideways a move will occurr. On this time frame 50dma above 200dma would be extremely bullish.

1 hour
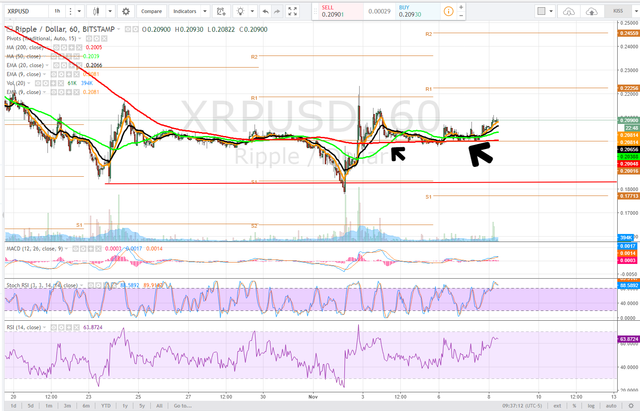
The 1 hour time frame is quite interesting with the 50dma crossing above the 200dma, back testing this bullish indicator and pushing higher. Bulls look for the 9 and 20ema to drive above the 50dma on this time frame. Shorter period moving averages above longer is bullish.
The 200dma, flat line on this time frame aligns with the pivot and provided consistent price support. The 200dma (pivot) is an area of demand. This is conducive to bullish price action.
Bulls should be looking for more price consolidation as the MACD curls down an opportunity to buy. the 50dma is a must hold and could give way to a test of pivot r1, $0.22 an area that bulls would like to reclaim as support.

Bullish Above: $0.23
Bearish Below: $0.198
RISK TRADE: Scale a long position here, add all the way to the 50dma (200dma if you have the risk tolerance for it).
Ripple is also an option for investment, not just trading considering their supporters in FINTECH and the banking sector. Do your own research, manage your own risk.
Don't forget to use stop losses!!!
Previous Articles:
<a href=https://steemit.com/bitcoin/@satchmo/ethusd-technical-analysis-november-4-2017-current-price-usd303">ETHUSD
BTCUSD
BCHUSD
ZECUSD
LTCUSD
BTCUSD
ETHUSD
BTCUSD
LTCUSD
XMRUSD
Follow at your own risk, Not a financial adviser, understand the risks associated with trading and investing. Manage your own Risk - in other words you could lose it all and it's your own fault.

Hm... RSI is very high ATM and the price has been above bollinger bands, don't you think it is a bit risky?... I wouldn't put money on it since the risks seem higher than the reward, can you show me if I am wrong and how/why?
Thank you! :D
Rsi on the daily time frame is not high at all. We look there to discern longer term possibilities and move intraday to try and determin when.
yes, maybe, thanks
@satchmo Great analysis. I see targets at 0.260000 and 0.300000.
I Liked your post, Keep it up brilliant!
I've resteemed your post!
nicely put, thank you *thumbs up
Thanks! Looking forward to the conference
One minute silence for the people who were ready to get free BTC Gold :) Useful information shared~
thanks for information @satchmo
awesome:)