XMRUSD - Technical Analysis October 18, 2017 - Current Price $88.60.

XMRSUD
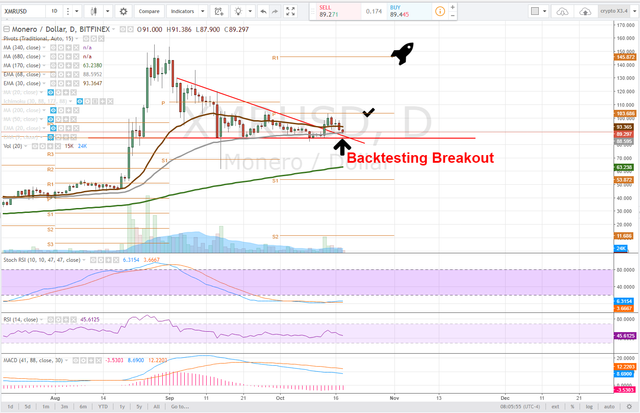
We were watching XMRUSD last week for a breakout of the wedge formation it was in and test of the daily pivot approximately $103. Breaking above would have given way to the next bull run, however, the price has since re-traced and we are looking for a backtest of the wedge formation - price verification.
daily
On the daily time frame, resistance was found at the pivot $93.55. The price has pulled back all the way to the 68ema ($88.59) where it is finding support. The 30ema is now resistance.
After breaking out of the triangle formation falling back down is not necessarily bearish, nor is it bullish. The price is bullish if volume and support is found at the trendlines of the previous formation.
The stochastic RSI on this time frame is flat lining in downtrend as the MACD heads towards deviation zero.

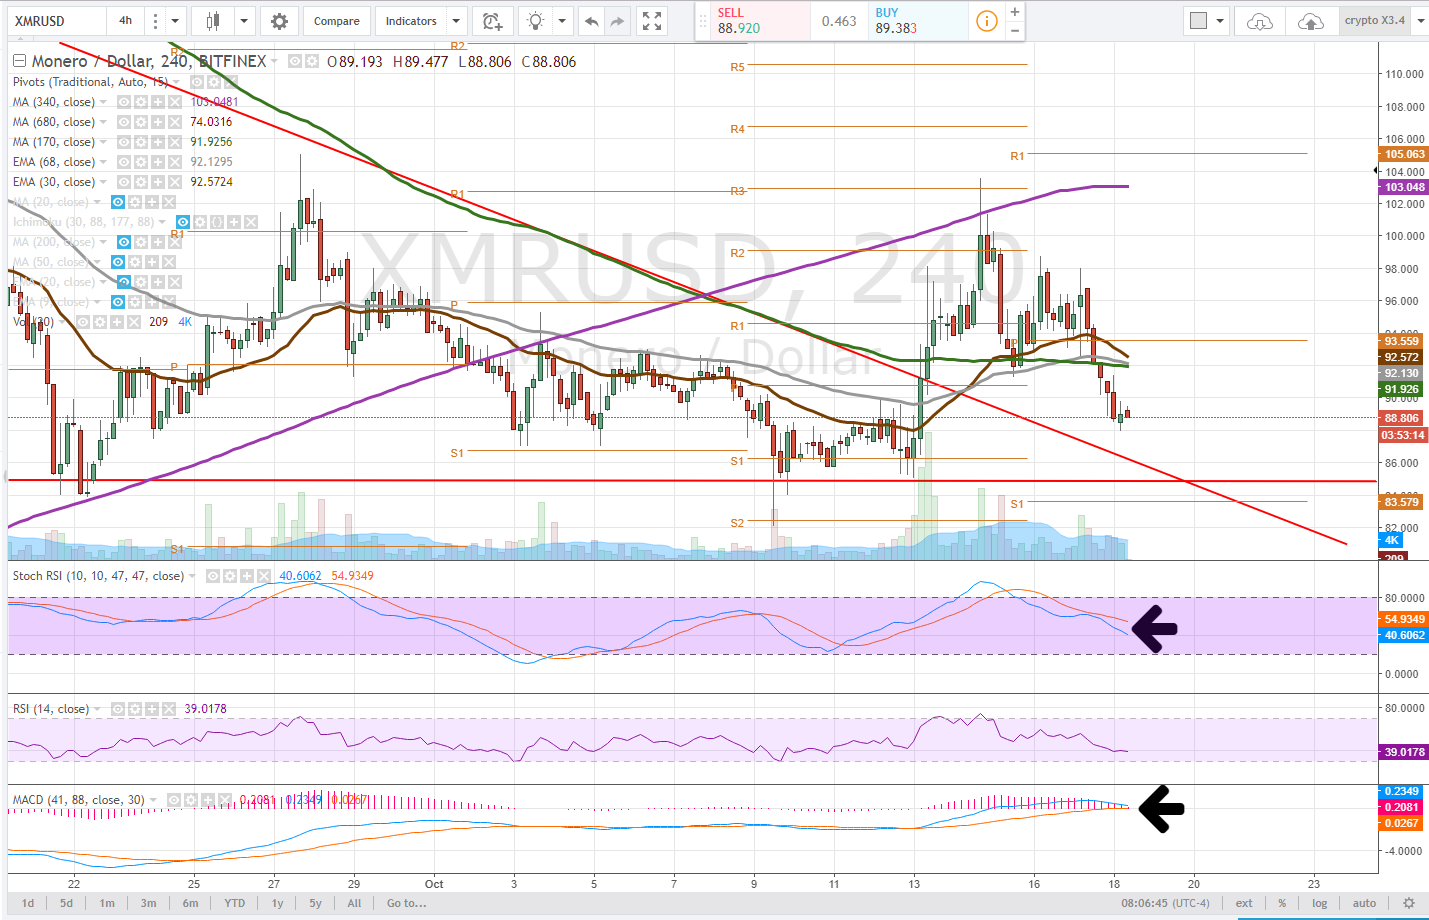
4 hour
On the 4 hour time frame, the 340dma clearly acted as resistance as the price fell back down through the 170dma. We are watching for a bear flag to form on thi time frame. The MACD appears ready for a bearish cross as the stochastic RSI is trending downwards.

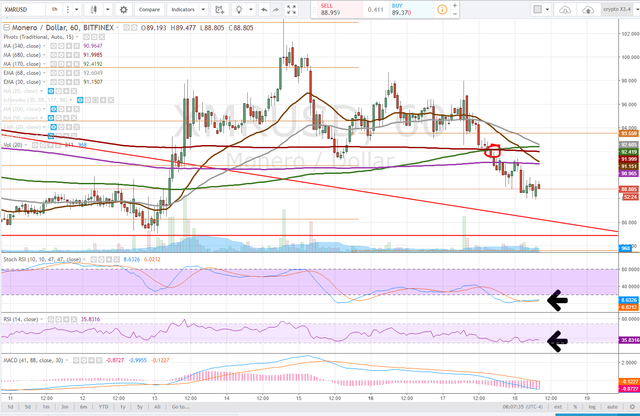
1 hour
The 1 hour time frame appears lifeless as the RSI has gone stagnant and the stochastic RSI and MACD drift. The bear flag forming is more obvious on this time frame and the convergence of moving averages is quite bearish.
A glimmer of hope for bulls on this time frame, is the 170dma did manage to cross bullish above the 680dma -- this is a golden cross on this time frame and is indicative of the longer term price trend being bullish.
However, Currently traders should be watching for a test of the trendlines. If the fail to act as support, the last hope is pivot s1 on the 1 hour, $83.57.

Wait for clarity, buying here is risky, odds lie with the shorts, but we have missed the meat of the move.
Bullish Above: $93.55 - very bullish above $104
Bearish Below: $84
RISK TRADE: Short to lower trendlines and go long there
Don't forget to use stop losses!!!
Previous Articles:
ETHUSD
BTCUSD
DASHUSD
ZECUSD
BTCUSD
LTCUSD
XMRUSD
ETHUSD
NEOUSD
Follow at your own risk, Not a financial adviser, understand the risks associated with trading and investing. Manage your own Risk - in other words you could lose it all and it's your own fault.

Thanks for the analysis, I always read stuff like this, then checks against my thoughts.
Great content dear @satchmo
Nice article thanks for analysis
Nice post..
front-runner , Thanks you
Upvoted and RESTEEMED :)
Thank you so much for the analysis, I'll do more research and see if its really a good time to buy or not, thank you for sharing
i like this.. always read stuff like this, then checks against my thoughts.
i have some post .....you can check
here https://steemit.com/crypto/@letsmakes/newsflash-bitcoin-cost-goes-crazy-tears-past-usd6-000