Well you are recognizing the triangle corrections on the zoomed in chart. I think it is also good to zoom out a little for a different perspective. And try linking things with the 1-5 impulses. I haven't spent a lot of time on the BTS chart today, but I actually think it might channel horizontally a bit. If you zoom out, you could have A-B-C-D of an A-E channel in, with potentially one more drop close to $0.35...my thoughts anyway.
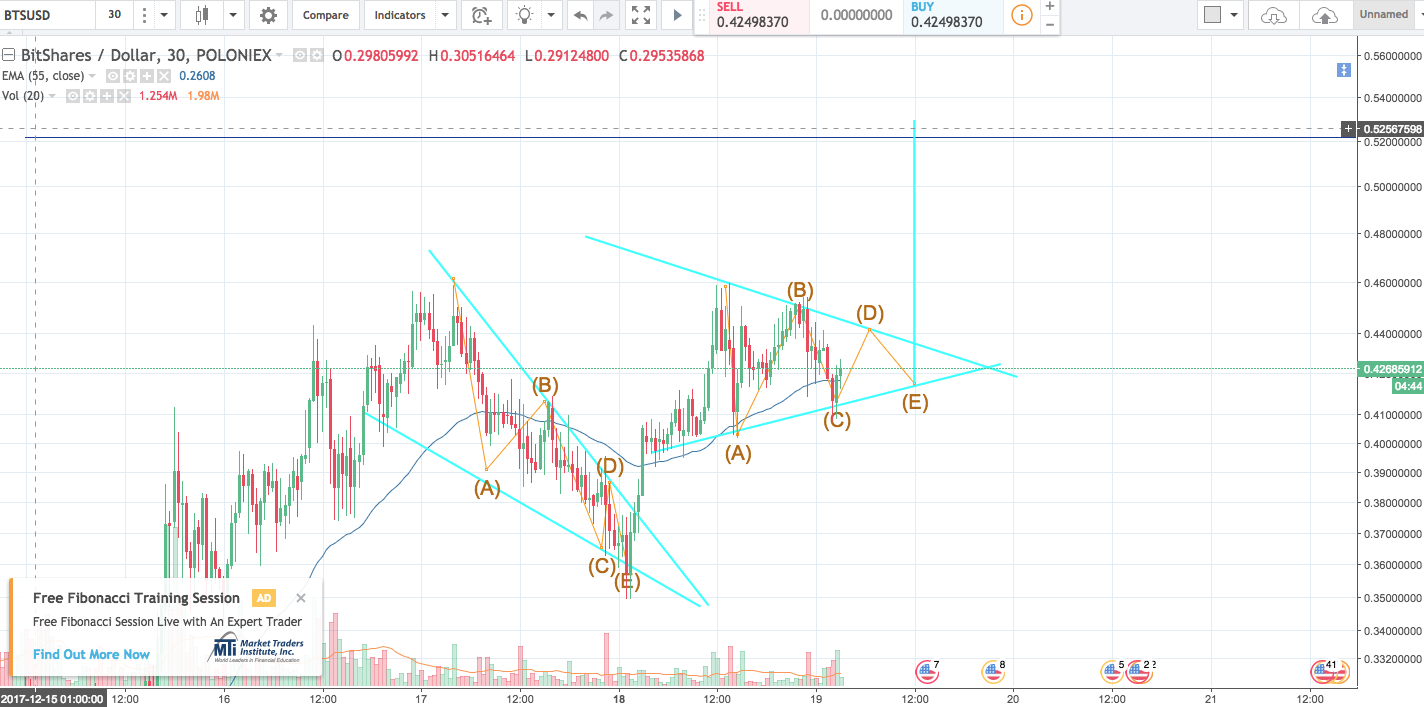
Ok thanks for the feedback! I'll keep practicing. looks like it broke out of the triangle at D, so E didn't get hit. I can post a zoomed out view and show where my 1-5 impulses are maybe tomorrow. the top of my blue line would be my wave 1 target, close to Haejin's .52 cent call.. but he did say could be much higher.. and in an earlier post was calling $1-19 if things go crazy vertical... so I'm holding, even though I would be tempted to sell at .52 and ladder back in at the W2 target to accumulate more BTS.
here's my zoomed out impulse 1-5 view. used fib extension .318 to get W3 target. and 1 to get W5 target.
here's a zoomed in view with a horizontal channel. i'm having a hard time finding your ABCD correction when you zoom out. i calculated my W1 target by using the distance from the top and bottom of the channel. how does one know when that channel breaks to the upside or downside? thank you!
Well you are recognizing the triangle corrections on the zoomed in chart. I think it is also good to zoom out a little for a different perspective. And try linking things with the 1-5 impulses. I haven't spent a lot of time on the BTS chart today, but I actually think it might channel horizontally a bit. If you zoom out, you could have A-B-C-D of an A-E channel in, with potentially one more drop close to $0.35...my thoughts anyway.
Ok thanks for the feedback! I'll keep practicing. looks like it broke out of the triangle at D, so E didn't get hit. I can post a zoomed out view and show where my 1-5 impulses are maybe tomorrow. the top of my blue line would be my wave 1 target, close to Haejin's .52 cent call.. but he did say could be much higher.. and in an earlier post was calling $1-19 if things go crazy vertical... so I'm holding, even though I would be tempted to sell at .52 and ladder back in at the W2 target to accumulate more BTS.
here's my zoomed out impulse 1-5 view. used fib extension .318 to get W3 target. and 1 to get W5 target.
here's a zoomed in view with a horizontal channel. i'm having a hard time finding your ABCD correction when you zoom out. i calculated my W1 target by using the distance from the top and bottom of the channel. how does one know when that channel breaks to the upside or downside? thank you!