How To Crypto-Trade with Profit - 101: Time-Frames
Alright, since you’re probably new to trading and don’t know anything about … really anything, I’m going to show you one of the basics of the basics, starting with looking at charts at different time frames.
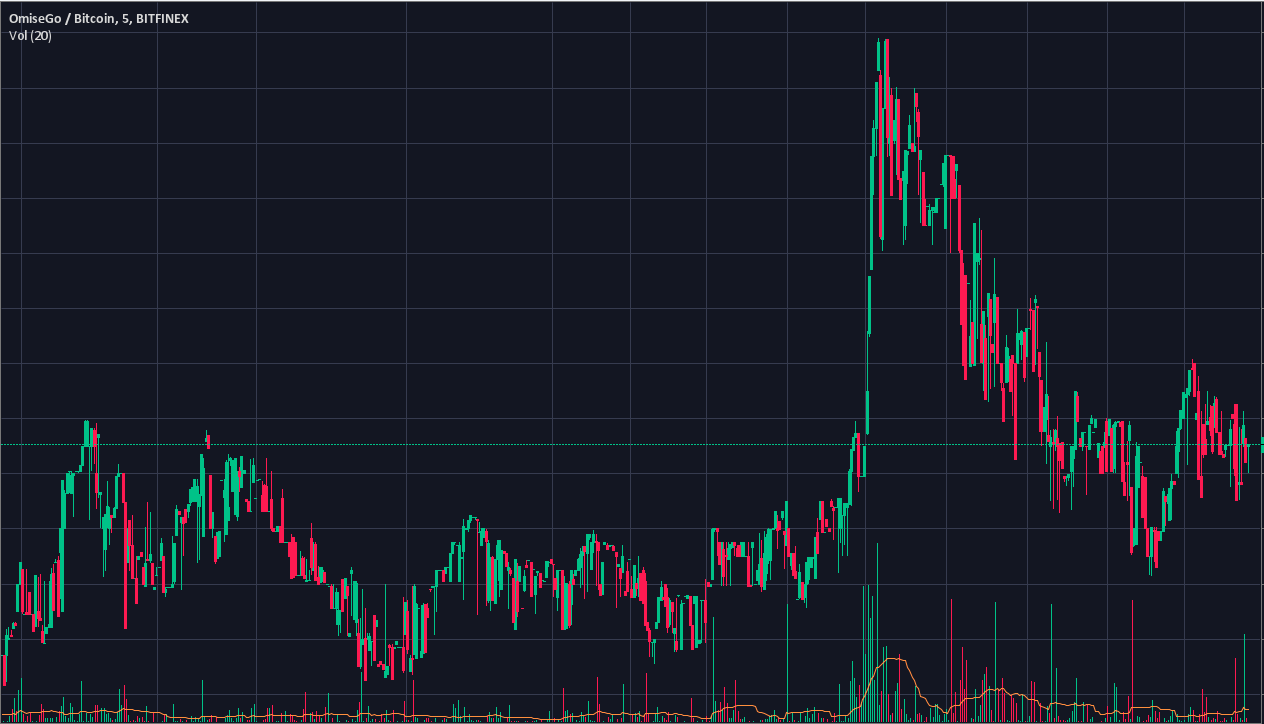
Let’s take a shot at this chart:

First impression? Kinda wishy washy huh? You can see it's coming off a peak and is in a "trading range" at the end. If the only information given is this picture I would say „gtfo outta here“. Yes, there is a trendline, yes it’s kinda making higher highs and lower lows but it doesn’t mean anything when you don’t get more context. Without axes you can't tell shit. The peak could be a 1% increase during a whole year, you wouldn't want to trade that, unless stupid runs in your family name.
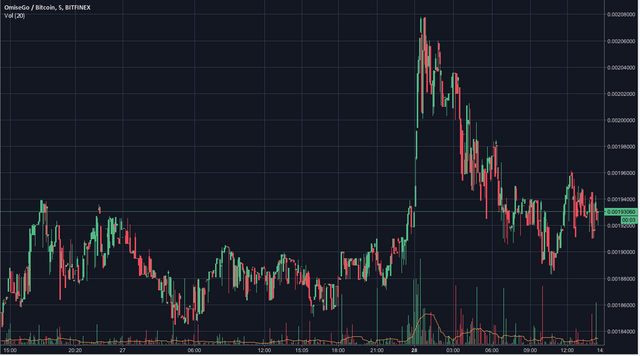
Here is the same chart with axes:

It’s a five-minute timeframe. FIVE-MINUTE. Unless you want to trade in pennies and profit off 1% swings (and waste your own time doing it), let's zoom out.
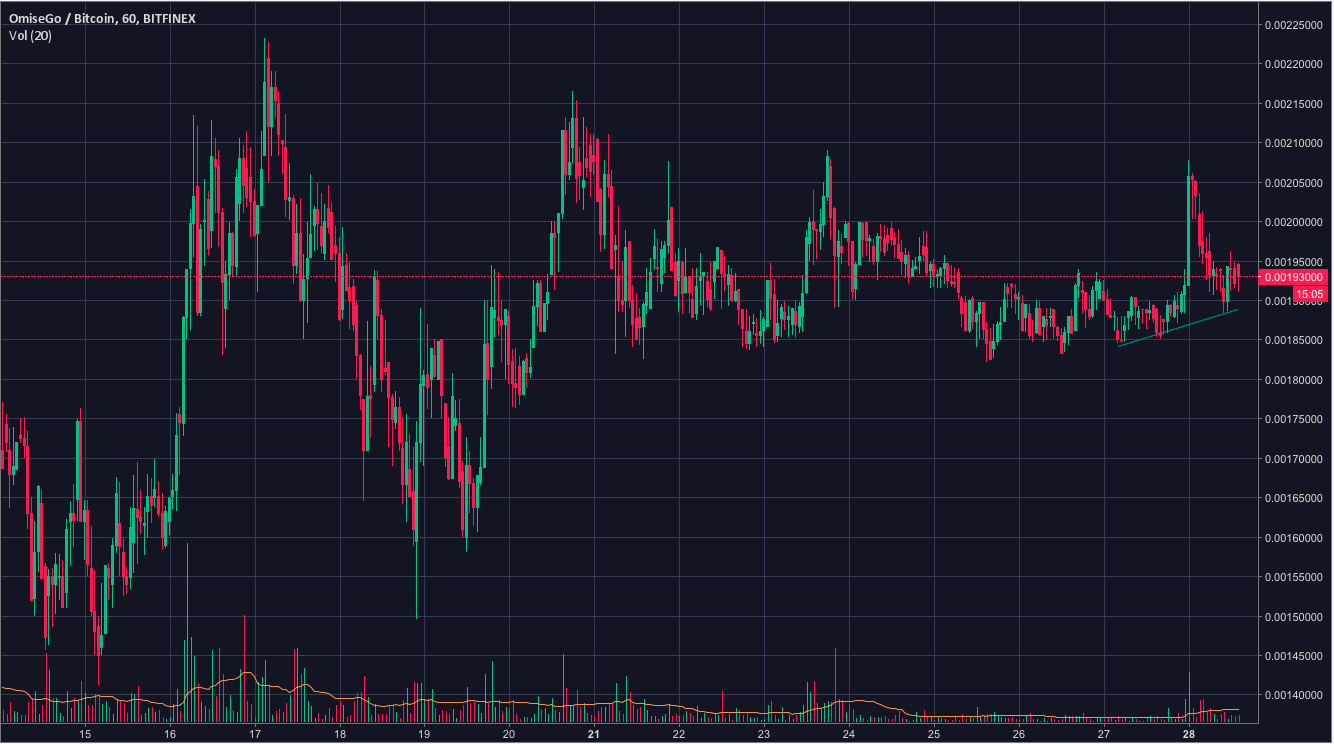
Same coin, 1-Hour timeframe:
Entirely different picture, isn’t it? It’s in a trading range with steady support around the 185 mark, signaling a possible accumulation phase. We can trade with that. But to maximize gains and minimize risk (You and me both like MOAR money, don't deny it, I certainly won't!), let’s get more context.
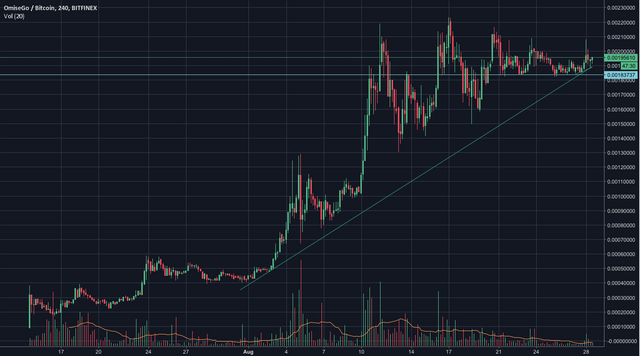
Here is the 4-hour chart:

BUY BUY BUY! This is a no brainer. It's on an uptrend and with no indication of a stop towards the bull trend. Why? higher lows => buyers control the market => BULL MARKET.
So if you're clever, you've now witnessed the importance of timeframe in charts. Use them to compliment each other, DON'T MAKE A DECISION RESTING ON A SINGLE TIME FRAME. Get more information, take a look at the bigger picture.
it's non-negotiable.