Bitcoin and Crypto Tech Analysis For dummies
Crypto traders have several tools to assess the cryptocurrency market. One of them is an approach known as Technical Analysis. Using this method, traders can get a better understanding of the market sentiment and isolate significant trends in the market. This data can be used to make more educated predictions and wiser trades.
Tech analysis considers the history of a coin with price charts and trading volumes, no matter what the coin or project does. As opposed to technical analysis, fundamental analysis is more focused on establishing if a coin is over or under valued.
To get a better idea of technical analysis, it is crucial to understand the fundamental ideas of Dow Theory that tech analysis is based on:
The market considers everything in its pricing. All existing, prior, and upcoming details have already been integrated into current asset prices. With regards to Bitcoin and crypto, this would be comprised of multiple variables like current, past, and future demand, and any regulations that impact the crypto market. The existing price is a response to all the current details, which includes the expectations and knowledge of each coin traded in the market. Technicians interpret what the price is suggesting about market sentiment to make calculated wise predictions about future pricing.
Prices movement aren’t random. Rather, they often follow trends, which may either be long or short-term. After a trend is formed by a coin, it’s probably going to follow that trend to oppose it. Technicians try to isolate and profit from trends using technical analysis.
‘What’ is more important than ‘Why’. Technicians are more focused on the price of a coin than each variable that produces a movement in its price. Although multiple aspects could have influenced the price of a coin to move in a specific direction, Technicians assertively review supply and demand.
History tends to get repeated. It is possible to predict market psychology. Traders sometimes react the same way when presented with similar stimuli.
Trend Lines
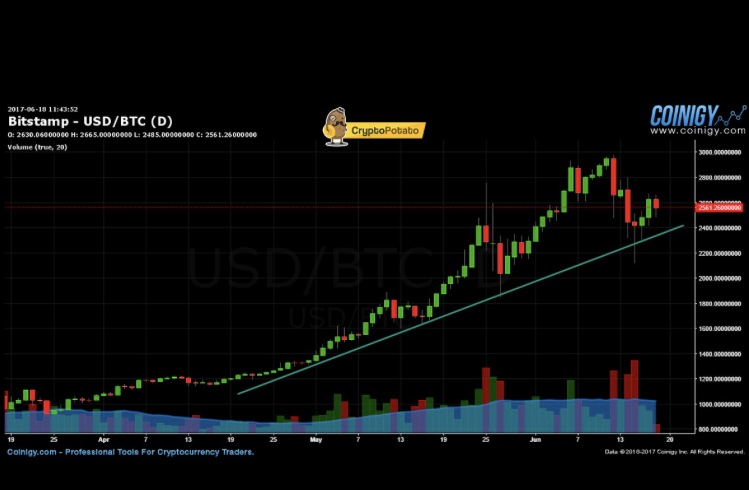
Trend lines, or the typical direction that a coin is moving towards, can be most beneficial for traders of crypto. That said, isolating these trends can be easier said than done. Crypto assets might be substantially volatile, and watching a Bitcoin or crypto price movement chart will probably reveal a selection of highs and lows that form a linear pattern. With that in mind, Technicians understand that they can overlook the volatility and find an upward trend upon seeing a series of higher highs, and vice versa – they can identify a downtrend when they see a series of lower lows.
Additionally, there are trends that move sideways, and in these cases, a coin doesn’t move significantly in either direction. Traders should be mindful that trends come in many forms, including intermediate, long and short term trend lines.

Lines
Important tip: you must be accurate when drawing these trend lines! How to do it perfectly? As you hover each candle you will notice the lowest price of it marked as “L” in the top bar (or the highest price, “H”, if line’s direction is down). Now place your line exactly there. Next, extend the line roughly, as it touches the next candle in the trend line, do the same – check exactly the “L” for that candle. Now correct your line. Final step is to auto-extend the line using line’s Settings – Line extend to the desired side (probably right). This explain was for Coinigy charts, but should work well with other chart applications.
Resistance and support levels
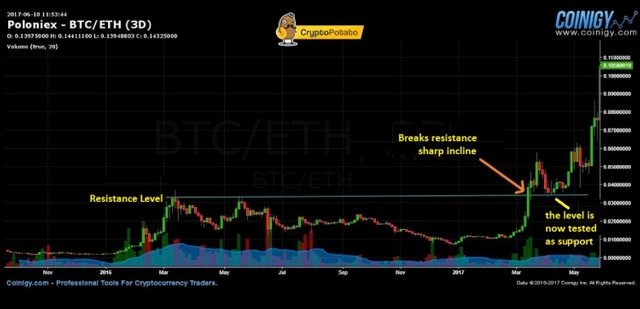
As there are trend lines, there are also horizontal lines that express levels of support and resistance. By identifying the values of these levels, we can draw conclusions about the current supply and demand of the coin. At a support level, there seems to be a considerable amount of traders who are willing to buy the coin (a large demand), i.e., those traders believe that the currency is priced low at this level and therefore will seek to buy it at that price. Once the coin reaches close to that level, a “floor” of buyers is created. The large demand usually stops the decline and sometimes even changes the momentum to an upward trend. A level of resistance is exactly the opposite – an area where many sellers wait patiently with their orders, forming a large supply zone. Every time the coin approaches that “ceiling”, it encounters the supply stacks and goes back.
There is often a situation in which trade-offs can be between support and resistance levels: gathering close to support lines and selling around the resistance level. This opportunity usually takes place when lateral movement is identified.
So what happens during breakout of resistance or support level? There is high probability that this is an indicator which is strengthening the existing trend. Further reinforcement of the trend is obtained when the resistance level becomes support level, and being tested from above shortly after the breakout.
Note: False breakouts occur when a breakout happens, but the trend doesn’t change. Hence, we must use some more indicators, such as trading volume, to identify the trend.

Moving averages
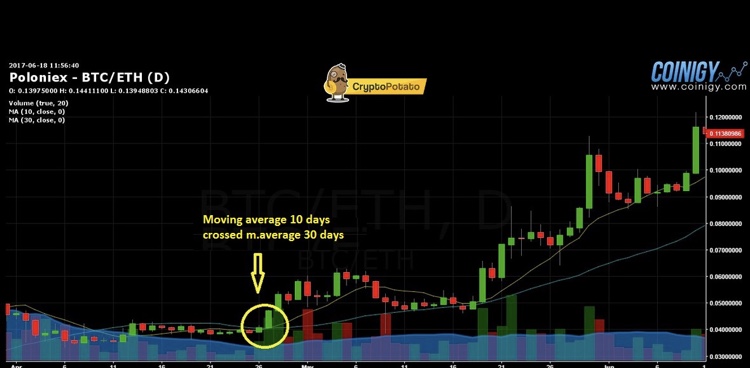
Another technical analysis tool for crypto currencies and technical analysis in general, in order to simplify trend recognition, is called moving averages. A moving average is based on the average price of the coin over a certain period of time. For example, a moving average of a given day will be calculated according to the price of the coin for each of the 20 trading days prior to that day. Connecting all moving averages forms a line.
It is also important to recognize the exponential moving average (EMA), a moving average that gives more weight in its calculation to the price values of the last few days than the previous days. An example is the calculation coefficient of the last five trading days of EMA 15 days will be twice that of the previous ten days.
In the following graph we can see a practical example: If a 10-day moving average crosses above a 30-day moving average it might tell us a positive trend is coming.

Trading Volume
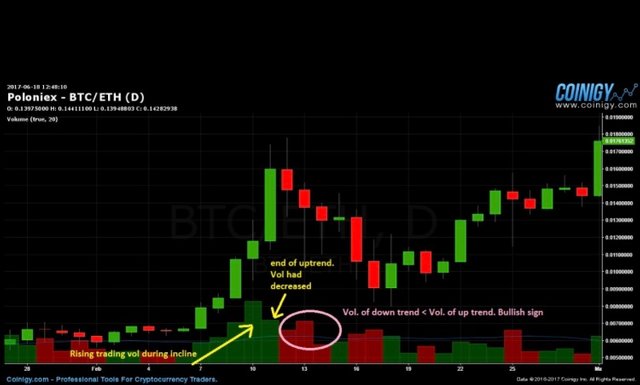
Trading volume plays an important role in identifying trends. Significant trends are accompanied by a high trading volume, while weak trends are accompanied by a low trading volume. When a coin goes down it is advisable to check the volume which accompanied the decline. A long-term trend of healthy growth is accompanied by a high volume of increases and a low volume of declines. It is also important to see that volume is rising over time. If the volume is decreasing during increases, the upward trend is likely to come to an end, and vice versa during a down trend.

Not on the technical analysis alone
Using technical analysis, traders can identify trends and market sentiment and they also have the ability to make wiser investment decisions. However, there are a number of key points to consider:
Technical analysis is a practical method that weighs past prices of certain coins and their trading volume. When considering entering a trade, it is not recommended that you only rely on technical analysis. Especially in the field of crypto, a field that often generates news, there are fundamental factors that have a significant impact on the market (such as regulations, ETF certificates, mining hash, etc.). Technical analysis only ignores and can’t predict these factors, so the recommendation is to mix together the technical analysis and the fundamentals analysis to make wise investment decisions.
An analyst who makes a decision to buy a particular coin due to fundamental reasons can get technical support or find a good technical entry point and thus strengthen the trade’s ROI.
Shoutout to Cryptopotato, class article!