Description Of Scanner PHAROS For Crypto Exchanges Binance

The Scanner PHAROS for cryptocurrency exchanges BINANCE helps in the selection of current cryptocurrencies for intraday trading. The basis of the scanner-abnormal volumes that it detects by special algorithm.
The structure of our development consists of 3 parts:
Server part. The place where our algorithm is located, which processes all information coming from the exchange 24 hours . For safty operation, there are additional server and control are provided.
Telegram channel that receives part of the information about abnormal purchases we have found. The information is receiving within a minute after purchase.
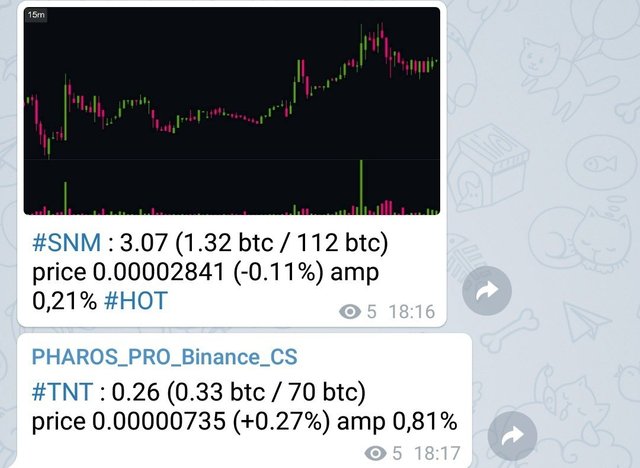
This is How Scanner Looks On Telegram.
- Mobile app for Android and IOS.
Let's take a closer look at the app.
- Total - the total amount of all manipulative purchases that the scanner has detected coin for the last 50 hours, in btc. Visually, they are also duplicated by vertical white lines on the chart of volumes below.
- Total - the total amount of all manipulative purchases that the scanner has detected coin for the last 50 hours, in btc. Visually, they are also duplicated by vertical white lines on the chart of volumes below.
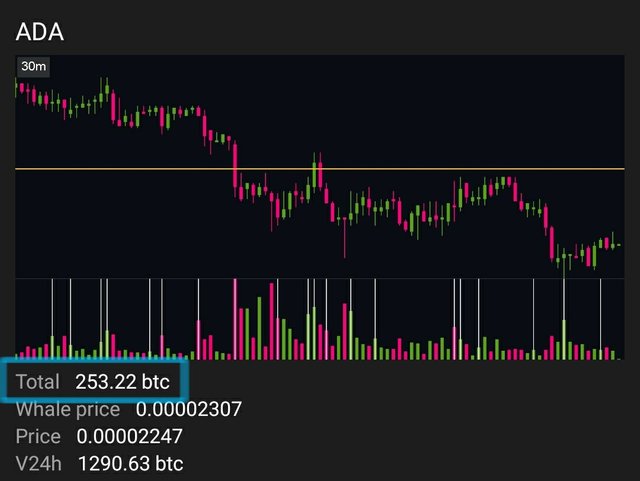
Total On ADA Coin On Last 50 Hours
- Whale price - "best ponit", the average price of all manipulative purchases. In addition, we can visually observe where the so - called "Best ponit" on the chart is-a yellow line. A good entry point for the maximum shuld ne lower from the whale price. We strongly recommend that you do not enter at a price higher than whale price. We must wait for the best point entry.
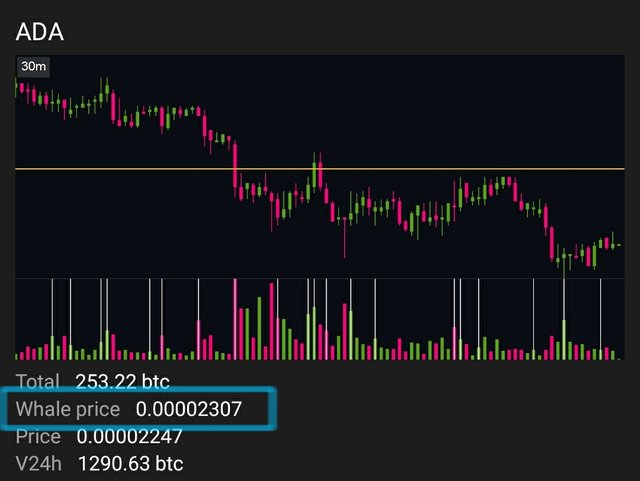
Whale price indicated in btc also the yellow line on the chart
- Price - the current price of the coin in btc. But do not forget that the application data updating every 10 minutes.
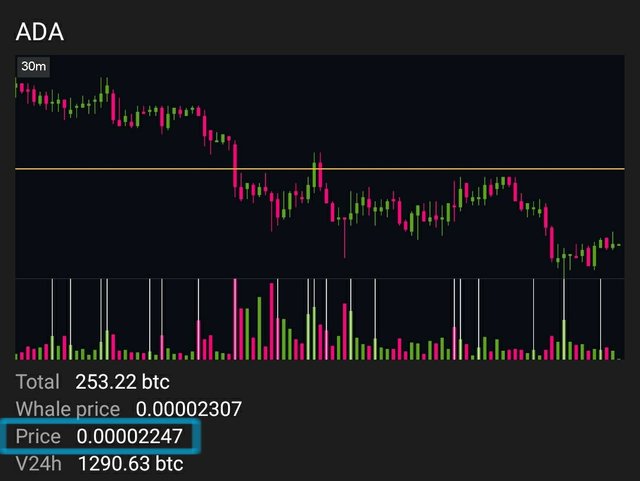
Current price for last 10 minutes
- V24h - 24 hour trading volume in btc of current coin.
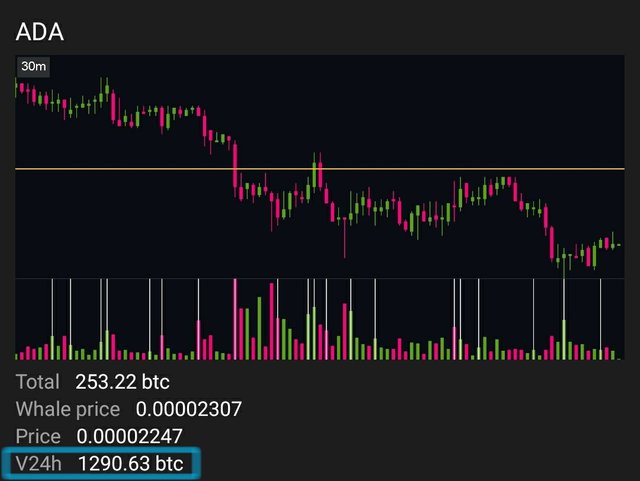
Daily Turnover In BTC
Clicking on the chosen coin, we turn to the next page to find more information about the scanner identified the procurement (the volume chart on the bottom they are white vertical lines), indicating:
"the volume per minute / volume for the day, the price (with the amplitude of minute candle), the date"
Hope You'll Like This Post.
Please Give It Follow & Upvote.