Technical analysis TT / BTC


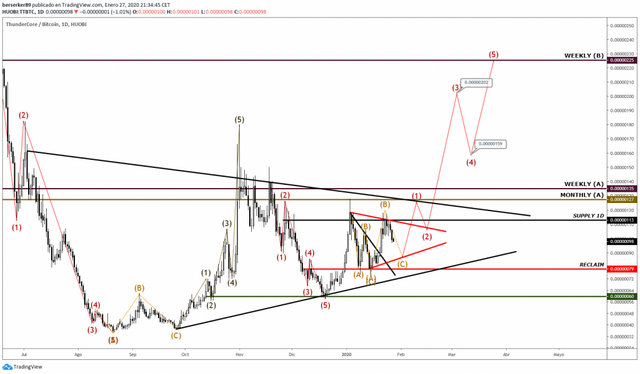
TT seen from the temporality of 1D we can see how the price currently is within a pennant in the smaller figure indicated within the chart by the two red diagonals, this is a continuation pattern, therefore, once we achieve the break up we should see the price looking for the break up of the trend diagonal of this accumulation phase, I have indicated this level within the chart by means of the large black diagonal, if we achieve a strong closing above this level we will see an upward trend with great earnings potential, the target is located at 0.00000225, indicated within the graph by the point WEEKLY (B).
In conclusion, TT is very close to finish the accumulation phase, we are in the final stage, at the moment the price is correcting within the minor figure, the recommended thing is to wait until the price reaches the demand located within the price range of 0.00000090 – 0.00000085, coinciding with the diagonal support of the red minor figure, a close below this level invalidates the pattern, however, we have the major support coinciding with the level of RECLAIM at 0.00000079, therefore, this currency looks very bullish in the short and medium term, we must only be very attentive to the action of the price in 1D and always remember to place your stop losses to avoid possible invalidations during the movement.
You can follow me on Twitter: https://twitter.com/armijogarcia
Posted from my blog with SteemPress : https://mentormarket.io/cryptocurrencies/mrbullishsail/technical-analysis-tt-btc-2/