Technical analysis TRX / BTC


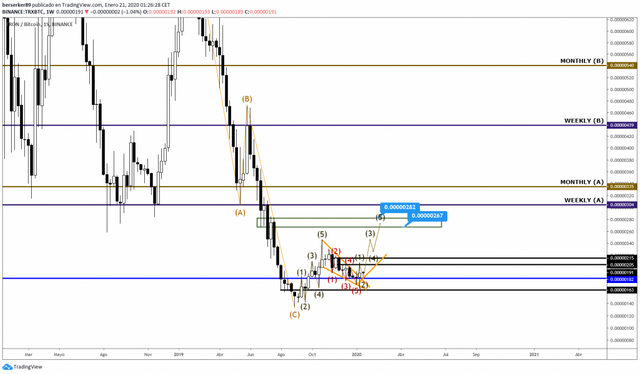
TRX seen from 1W we can see how the current candle has made the closing of the descending wedge in the smaller figure indicated by the two yellow diagonals, the candle closure has been with a bullish hammer shape, the price has formed a second HL above the support located at 0.00000182 indicated within the chart by the blue horizontal.

TRX seen from the 1D timeline we can observe more closely the current candlestick movement where we see how the price is currently making a short retracement towards 0.00000182 where we should end the waves (2) and have a next upward momentum towards the price range of 0.00000234 – 0.00000246, our high target is located within the price range of 0.00000267 – 0.00000282 indicated on the chart by the green rectangle, before this happens the price must overcome the resistance of the correction point two forming inside the falling wedge and maintain at all times the diagonal support of the current momentum, this diagonal is indicated on the chart by another yellow diagonal with upward slope.
In conclusion, TRX is in a good moment, in a short time we are going to have a bullish continuation of which we must also wait for a later retracement to be able to undertake a stronger and longer move, the major figure is a double-decker pattern, we have hammer candle in 1W and the price remains strong above the support, these are good buy indicators, however, I recommend to be very attentive to the price action in 1D and always remember to place your stop losses to avoid possible invalidations during the move.
You can follow me on Twitter: https://twitter.com/armijogarcia
Posted from my blog with SteemPress : https://mentormarket.io/cryptocurrencies/mrbullishsail/technical-analysis-trx-btc/