Technical analysis HBAR / BTC


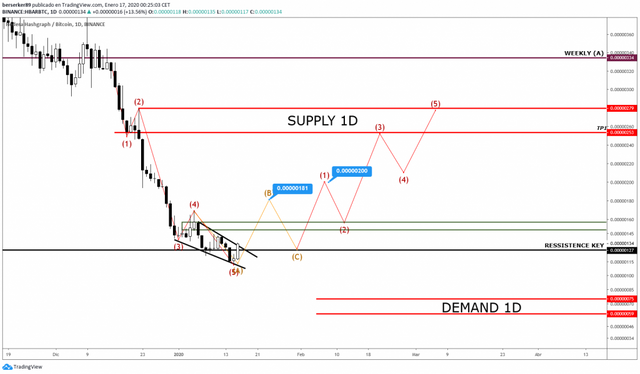
HBAR seen from the 1D timeline we can see how the candlestick structure has formed a downward wedge by slowly selling from 0.00000150 as a sign of a close trend change, the current candlestick is performing a pullback from the key resistance located at 0.00000127, signaled within the chart by the black horizontal, if we get the close above the diagonal resistance the chances of an upward movement towards the price range of 0.00000169 – 0.00000181 will be very high, however, we must wait for the candlestick closure for confirmation, inside the chart I have traced the ABC pattern that the price should form once we get the break of the minor figure, the point would be our most reliable entry after having a confirmation HL, if this scenario occurs we would have an EW movement towards the daily bid zone located within the price range of 0.00000253 – 0.00000279, indicated inside the chart by the two upper red horizontals.

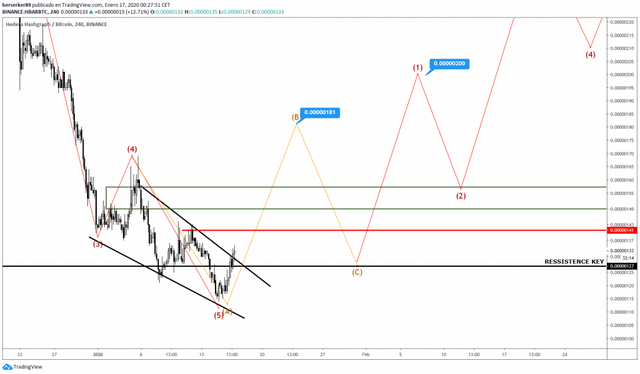
HBAR seen from the 4H timeline we can observe more closely the current movement where we see how the price has escaped above the diagonal and the current candlestick has tested it correctly, if closed in this way, the price could go in search of the resistance located at 0.00000141 indicated within the chart by the red horizontal, the price needs to recover that level to achieve the high range traced by the previous LH.
In conclusion, HBAR is in a good moment of the trend where we could see the accumulation pattern once we confirm the break of the smaller figure, once the price begins the impulse wave (1), its retreat should not be less than the price range enclosed by the green rectangle in the 1D chart, if this happens, the price could continue falling towards the daily demand located within the price range of 0.00000059 – 0.00000075, indicated inside the chart by the two red horizontal lines, therefore, I recommend to be very attentive to the 1D price action and always remember to place your stop losses to avoid possible invalidations during the movement.
You can follow me on Twitter: https://twitter.com/armijogarcia
Posted from my blog with SteemPress : https://mentormarket.io/cryptocurrencies/mrbullishsail/technical-analysis-hbar-btc/