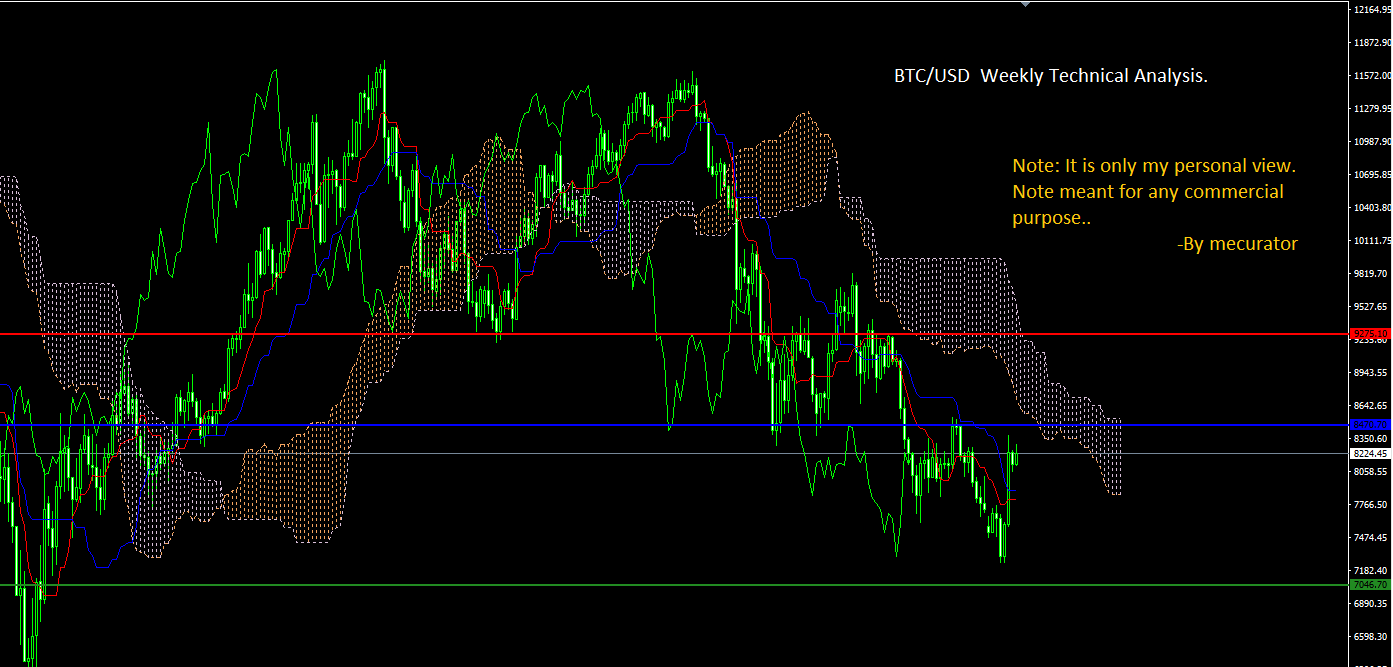
Btc Usd weekly technical analysis: 19.03.2018.

The overall technical analysis shows the bearish trend.
Weekly pivot level: 8470.0.
Weekly resistance levels: 9275.1, 10699.1, 11503.5.
Weekly support levels: 7046.7, 6242.3, 4818.3.
Present status of various technical indicators shows strong sell trend.
Present status of various moving averages shows a neutral trend.
The present market level is below the pivot level. It is also indicating overall sell trend.
If it moves downwards, the immediate support level is 7046.7.
We can take immediate resistance level as present pivot level.
If the market succeed to cross the pivot level upwards, The immediate resistance level will be 9275.1
Note: It is only my personal view and friendly sharing only.
It is not meant for any commercial purpose.