Bitcoin price analysis: Finding acceptance above 14k next milestone
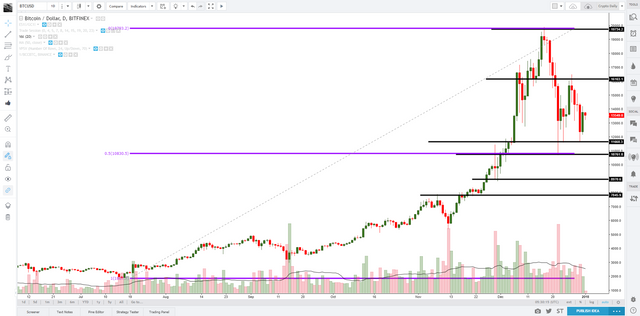
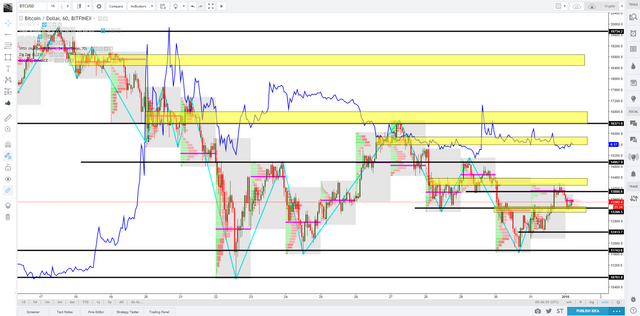
The bullish candle on Dec 31st carried little volume behind, which when compared to the robust increase in volume flows that pushed the price lower from Dec 27th swing high to the most recent lows, it doesn’t communicate the re-emergence of large enough players to see sustained follow through. By drilling down into the hourly chart and reading Dec 31st volume profile, a double bullish distribution in volume is observed, which should allow buyers a short term window of temporary control as long as the cluster of volume circa 12,800 is not re-taken and consolidation below seen, in which case, the bearish dynamics may resume. Note, the latest rise on Dec 31st has broken through a descending trendline.
- Bitcoin google trends on a short term downward trajectory
- Miners still attracted to BTC network for max profitability
- Bitcoin dominance chart sets fresh record lows
- Technicals not pointing at sustained bullish recovery
Summary
There is little evidence suggesting a long-lasting bullish recovery in the price of Bitcoin at this stage. The cluster of volume above 14k should prove a tough nut to crack. Additionally, the rebound in the bullish daily candle on Dec 31st carries little renewed buying commitment, with the volume below averages.
Moreover, decreasing google searches, the market shifting its focus towards a wider plethora of altcoins as reflected by BTC dominance chart and bitcoin cash consolidating at hefty levels are all supportive factors reinforcing the limited short term upside potential.
Google Trends
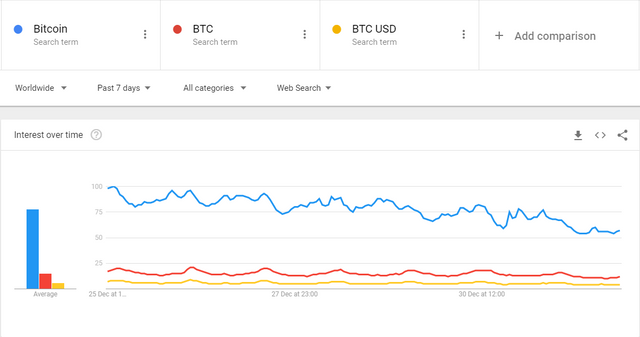
As illustrated in the chart below, in the last 7 days, google searches for Bitcoin-related terms reflect a loss of momentum as the christmas holiday period takes its toll on the interest of the global population towards Bitcoin. All 3 terms are printing lower lows and lower highs, not an ideal scenario to see a sustained recovery in global bitcoin prices as there is still a shortage of engagement by active or prospect bitcoin users.
Bitcoin / Bitcoin Cash Difficulty and Hash Rate
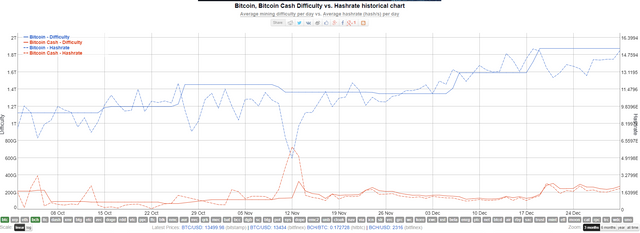
In term of mining difficulty, BTC continues to climb steadily, while BCC is struggling to make new all time highs in the last 2 weeks. Meanwhile, additional hashing power is being added to the BTC network to retest its recent peak, suggesting the committal stance by BTC miners, as they stick with the legacy network as the one that provides the most profitability. As long as the hash rate doesn’t move elsewhere, it reinforces the notion of BTC being the unquestionable leader.
Bitcoin Dominance
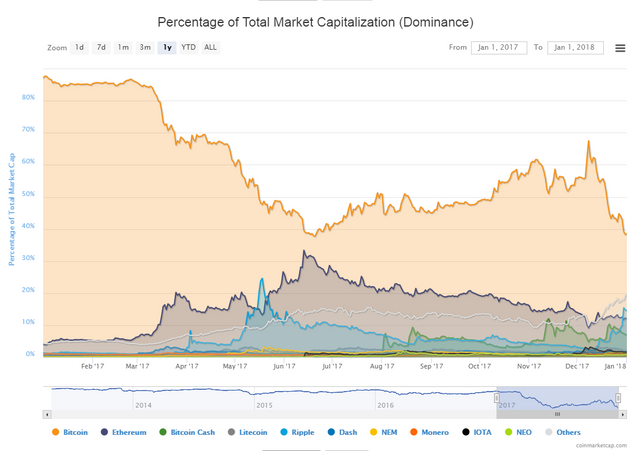
The bitcoin dominance chart has been setting fresh record lows, mainly driven by the massive pump in Ripple, up by more than 1,000% in recent months. Aside from the FOMO-led rise in Ripple, we have also seen the Altcoins complex take a turn higher, surpassing Ethereum in combined market cap. Overall, the chart below reveals low levels of enthusiasm towards Bitcoin, which resonates with the downward pressure in google searches.
Price Volatility
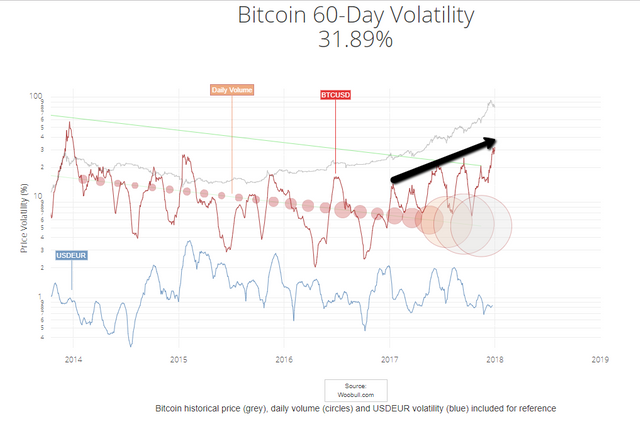
Price stability gives Bitcoin even more bullishness. While the projection is for the volatility to be reduced overtime as more liquidity providers enter the market place, the most recent pattern illustrates a worrying increase in the 60-day volatility swings, currently above 30%, an occurrence that hampers the appeal of BTC as a stable asset for wide usage.
Technical Analysis
Factored in: Daily Candle, Volume, Fibs, Trend+Horiz Lines, Cycles, BCH
Daily Chart
Hourly Chart
The bullish candle on Dec 31st carried little volume behind, which when compared to the robust increase in volume flows that pushed the price lower from Dec 27th swing high to the most recent lows, it doesn’t communicate the re-emergence of large enough players to see sustained follow through.
By drilling down into the hourly chart and reading Dec 31st volume profile, a double bullish distribution in volume is observed, which should allow buyers a short term window of temporary control as long as the cluster of volume circa 12,800 is not re-taken and consolidation below seen, in which case, the bearish dynamics may resume. Note, the latest rise on Dec 31st has broken through a descending trendline.
Should a bearish scenario materialize, 12.4k is the next immediate downside target (secondary in importance) ahead of 11.7k and 10.5k, the latter two likely to see an enormous number of bids ahead of the psychological 10k. The immediate rejections on Dec 24th and Dec 30th reflect strong buying interest in the premises sub 12k, with the 50% fib retrac from the 2k to 12k up-cycle, providing further confluence.
The existence of a solid horizontal support ahead of 13k, which aligns with Dec 30th POC (Point of Control), should provide near term buying interest as well. For buyers to fully regain the upper hand, the major cluster of volume in the 14k vicinity (yellow rectangle representing a volume cluster) must be absorbed, with the trailing of bids necessary so that equilibrium in prices is accomplished above the 14k for a potential target of 15k.
With regards to current cycle dynamics, the most recent price swings have resulted in two down-cycles (see turquoise lines) of equal proportions (Dec 27-28, Dec 29-31), suggesting that the market is still effectively within a developing bearish context while no acceptance is found above 14k, in which case, a more neutral stance will be achieved.
Looking at the price of Bitcoin Cash, which provides potential diverging opportunities given the negative correlation with Bitcoin, the consolidation of BCC/BTC at relatively hefty levels (illustrated by the overlapping blue line) subsequent to the spike seen from Dec 18th remains a negative input that should potentially cap prices from overshooting to the upside, unless such outcome is achieved via broad-based USDT weakness.
Disclaimer: The information contained herein is not guaranteed, does not purport to be comprehensive and is strictly for information purposes only. It should not be regarded as investment/trading advice. All the information is believed to come from reliable sources. The creator of the content does not warrant the accuracy, correctness, or completeness of information in its analysis and therefore will not be liable for any loss incurred.
Footnotes:
- Given the discrepancies in price levels on different exchanges, which may lead to arbitrage opportunities, in order to keep our technical studies consistent, the chart selected for analysis will always be the dominant by trading volume. Readers should extrapolate mentioned levels to own respective charts. You can see the name of the exchange on the top left corner of every chart.
- Google Trends have proven to be an accurate indicator to assess overall interest. As explained in the following link, Google Trends is a great way to track the growth of active bitcoin users.
- There is a negative correlation between Bitcoin Cash and Bitcoin as both compete for the status of the legacy Bitcoin. As such, by overlapping “BCC/BTC”, we can gauge diverging opportunities on the assumption that both crypto assets will be more often than not trading with a negative correlation.
- The zigzag indicator is utilized to represent the latest cycles in the market. Markets tend to move in cycles of 3 followed by a period of distribution and/or accumulation. Market Cycles are repetitive patterns that provide both market magnitude and timing studies in a very dynamic analytical approach.
- The volume profile analysis tracks trading activity over a specified time period at specified price levels. The study reveals dominant and/or significant price levels based on volume. This process allows to understand market opacity. The yellow rectangles in the chart represent the areas of most interest by trading volume, and should act as walls of bids/offers that may result in price reversals.
- On volatility, Willy Woo from Woobull.com mentions: “Price stability is needed before we get consumers buying and holding bitcoins for short and medium term spending. When this happens, it’ll have a large and positive impact on price.”
- Technical analysis is subject to fundamental-led news (one should see both components as inter-dependent). Any unexpected news on a specific project may cause the price to behave erratically in the short term, while still respecting the most distant price references given.
Congratulations @ivo333, you have decided to take the next big step with your first post! The Steem Network Team wishes you a great time among this awesome community.
The proven road to boost your personal success in this amazing Steem Network
Do you already know that awesome content will get great profits by following these simple steps, that have been worked out by experts?
BTCf8 is around $14.5K so hitting $14K per BTC should be quite achievable...
Not in the chart analyzed, which is bitfinex. Read footnotes please.
#bitcoin
i have not tried bitcoin, before what i should do
#bitcoin
I think not all of them can really predict the future price of bitcoin
#bitcoin
Sebenarnya harga bitcoin sudah gila sekarang, jika saya menyimpan bitcoin di dompet saya terlebih dahulu, mungkin tiba-tiba kaya
This is some fantastic analysis, well done !!
Thanks Jemook!