Cryptocurrency Technical Indicators: Bollinger Bands

This is the fifth article of ICODOG’s latest series, “Trading cryptocurrencies successfully”, which focuses on the main investment strategies to trade the latest sensation in the world’s asset market, cryptocurrencies. The previous article introduced the Renko charts, what it is and how to use it. In this article, we focus on Bollinger Bands and the significance of the indicator in cryptocurrency trading.
Bollinger Bands, abbreviated as BB, is a technical indicator represented with two lines above and below the 20-day simple moving average (SMA). The two bands (upper and lower) are plotted on the chart as positive and negative standard deviations away from the 20-day SMA. While the 20-day SMA is used as the standard, users can customize the chart to their preference. The BB indicator is used to measure the volatility of the asset’s price, in this case, a cryptocurrency, by examining the relationship between the bands and the price.

John. A . Bollinger (Image: World Top Investor)
The technical indicator was brought to life in the 80’s by a financial analyst named John. A. Bollinger. BB technical indicator filled a need to visualize changes in volatility. When the indicator was first being used volatility was known to be static but the knowledge around it increased. Today volatility is plotted on the chart as dynamic.
How to Calculate Bollinger Bands (BB)
As explained above, BB comprises of two bands oscillating between the 20 day SMA, namely the upper and lower Bollinger Bands. The steps below explain how to calculate points that plot the three bands on the chart.
1. Calculate the 20-day simple moving average
The first step is calculating the 20-day SMA by taking the average of the past 20 days closing prices which plots the first data point. The next point is plotted by taking the average of the next 20 days excluding the earliest price and including the latest price in the calculation.
The calculation is represented using the formula:
Where:
A = average in period N
N = number of time periods
2. Calculate the standard deviations
Once you calculate the 20-day simple moving average, the next step is to calculate the positive and negative standard deviations. Standard deviation is a measure of volatility and the shrinking and expanding of the bands is a signal of low and high volatility respectively. Standard deviation is a measure of the variance of a given value from the data set average.
To calculate the upper BB (positive standard deviation), take the square root of the variance and multiply it by 2. The variance is calculated as the square of the differences from the mean. Add the value of double the standard deviation to the 20 day SMA and plot on the chart.
To calculate the lower band, take the standard deviation and multiply by two as done in the upper band. However, instead of adding the value, subtract it from the 20-day SMA and plot the value on the chart.
Upper Band = 20 Day SMA + (Standard Deviation x 2)
Lower Band = 20 Day SMA - (Standard Deviation x 2)
3. How to read and understand Bollinger Bands
Before starting this section, it is crucial to note that Bollinger Bands are not perfect in giving a signal to which price will move, pretty much as all the indicators. However, a number of traders believe that a constant touch of price on the upper band, or nearing the band shows the cryptocurrency is overbought, triggering a sell signal. The vice versa is also a common perception that the price closing in on the lower band or crossing it shows an asset is oversold hence a buy signal.
While reading Bollinger Bands and the price constantly hits the lower band, remaining between the 20 day SMA and the lower band, then moves above the 20-day SMA, it shows signals of a reversal. As a trader, this offers a buy signal with the upper BB as the target for the trade. The reverse price action also works in a similar manner.
The Squeeze and Breakouts
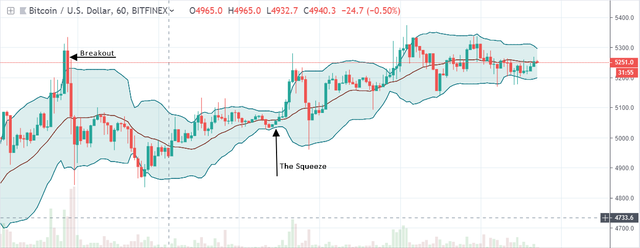
When the bands come close together, constricting the moving average, it is called a squeeze. A squeeze signals a period of low volatility and is considered by traders to be a potential sign of future increased volatility and possible trading opportunities. Conversely, the wider apart the bands move, the more likely the chance of a decrease in volatility and the greater the possibility of exiting a trade.

The squeeze and Breakouts visualized
Breakouts refer to the price crossing and closing above the upper or lower bands. Breakouts are a rare event to occur and signals a strong uptrend or downtrend in the price.
Remember, the squeeze and breakouts are not price signals but rather show the extent of volatility on the price of the cryptocurrency.
Conclusion
Bollinger Bands offers the users an easy way to tell the volatility of price and make decisions on that information. Unlike other indicators with static interpretations, BB offers dynamic interpretations as the indicator has various reading points. Remember, no technical indicator is 100% accurate in predicting the price and BB is no different.


