Sphere (SPHR) - Multiple Indicators Lining Up For Impulsive Breakout On Bittrex
This might be completely crazy, but I just loaded up on Sphere (SPHR) on Bittrex. Here's why ...
I am trading this coin strictly off of technical analysis, and will present my TA below. Before I do, I will attempt to present every caveat as to why you may NOT want to trade it. Caveat Emptor.
First, know that while Sphere has been around for almost a few years now, at first glance, the coin looks shady as hell!
Consider the following:
- Bittrex is the only exchange SPHR is currently traded on.
- If you visit SPHR's BitcoinTalk announcement page, it's practically a ghost town. So is their Twitter account.
- Visit their website, and you'll be greeted by a dull landing page where it says only that, "SPHR will be swapped to a ERC20 Token with burn functions on the Ubiq Network. More details coming soon."
- Some users have noted that the developers of this project appear to have vanished, or so it seems.
Not too reassuring, eh!?
That said, I will present some additional information from another recent article at the end of this post that may corroborate why the coin could be gearing up for a nice move.
Before I get into the chart analysis, please also be aware that I am relatively new to crypto coin trading, having only earnestly begun studying since later September/early October. I have only ever made two calls publicly before, and both proved wrong. Before the last big pump on LSK I had thought it was forming a head and shoulders and about to go into a bear trend, and it ended up reversing and making a nice gain. The other one was that after Bitcoin's first recent correction down to $11.5k, from which it had bounced and started rising, I had called another bottom to come at $10k. Although it did hit a double bottom at its previous low of around $11.5k, so I was not too far off on this one, and at least I got it right that the correction was not over. Still, I am by no means a trading guru. So take the following analysis for what it's worth.
Without further ado ...
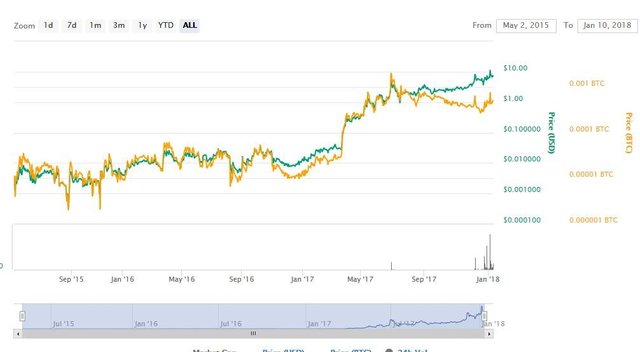
Here is Sphere's simple line chart from CoinMarketCap. Note how the BTC value and the USD value are divergent. It shows SPHR has remained relatively stable against bitcoin over the past few months, while its dollar value has risen. I am not certain but this may be an indicator it will begin to rise against btc as btc also begins rising against the dollar, so the two start to converge again. Note also the nice surge in volume over the past month.
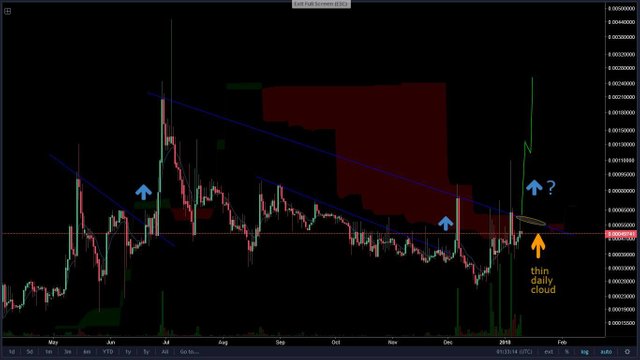
Here's a graph of the daily time frame. Note by the three blue lines, how when SHPR breaks above a trend line it tends to get quite impulsive, making a huge spike up, then falling down almost as fast. Currently it looks to be approaching a pretty long trend long going back to July. If/When a new daily candle opens above this trend line, and breaking through the ichimoku cloud, I'd say it's back up the truck time.
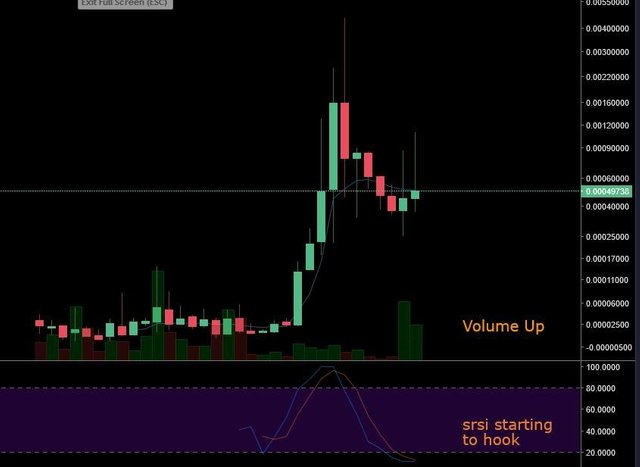
Here's a view of the monthly candles. Notice the Stochastic RSI appears as though its ready to cross upward.
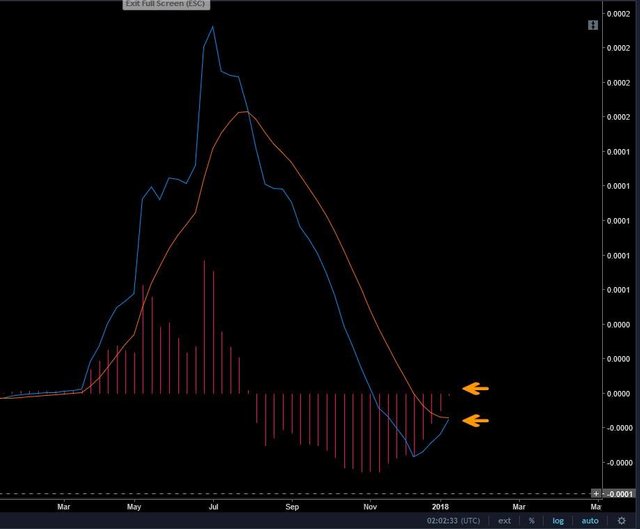
On a the weekly time frame, MACD looks nice. Just starting to cross over, and the momentum on the histogram show its about to break above the neutral plane.
On the 3-Day MACD is also just now moving above the waterline.
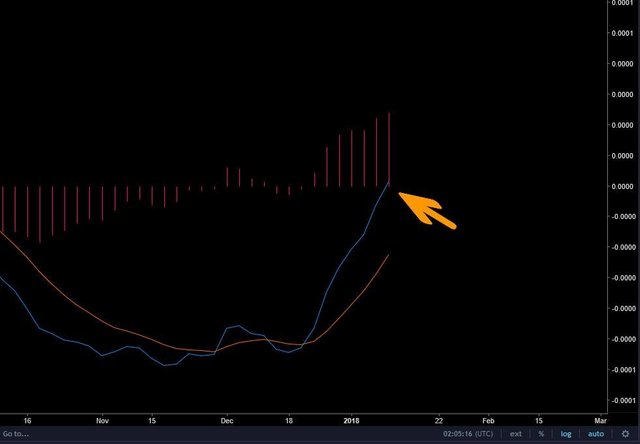
.... and the 6-hour.
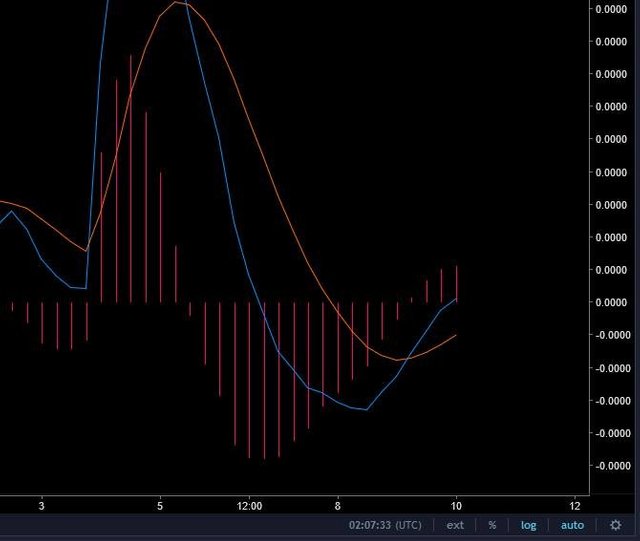
Here's the hourly time frame. Note how uncannily the same pattern seems to be repeating itself.
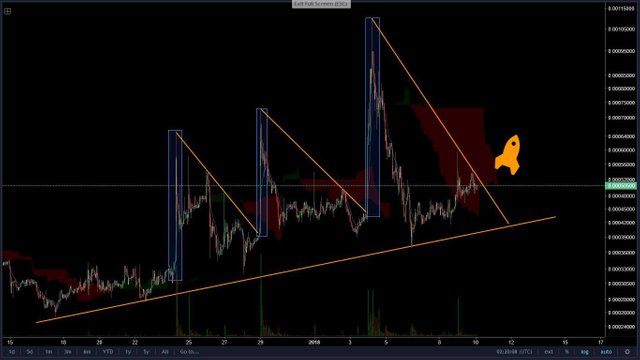
It isn't too often that I see indicators across a wide range of time frames all lining up so well at the same time, which is the reason I believe SPHR could be about to make another impulsive break out, similar to it's previous break out moves.
On this chart I mapped potential targets based on previous resistance points. I did try to overlay Fibonacci extensions but did not find any real overlap. I'm setting my sells in line with the previous resistance as potential targets, at 85000, 130000, 200000 - 250000. If it goes Hells Bells, next stop after that may be 450000.
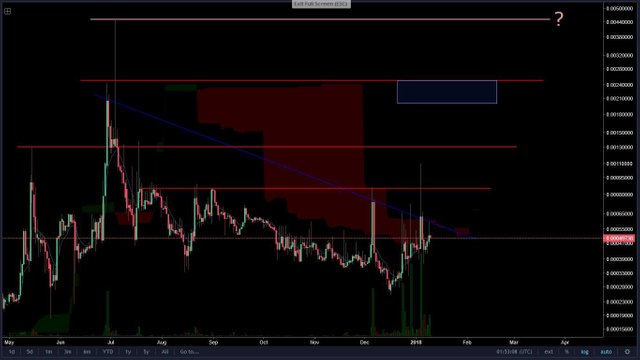
Judging by it's chart history, the price of Sphere can jump quite impulsively. During it's run-up in early July, the price spiked by 500% in just 3 days, so I don't think another strong move like this is out of the question.
Again, I don't have a track record like some of the pro traders. This is my reading of the chart and it is open for feedback and constructive criticism. I've hesitated to openly publish calls in the past for fear of sticking my neck out there, but I figure this is putting some more skin in the game, and if anything, if the trade works out I hope it will be of benefit to others to share it.
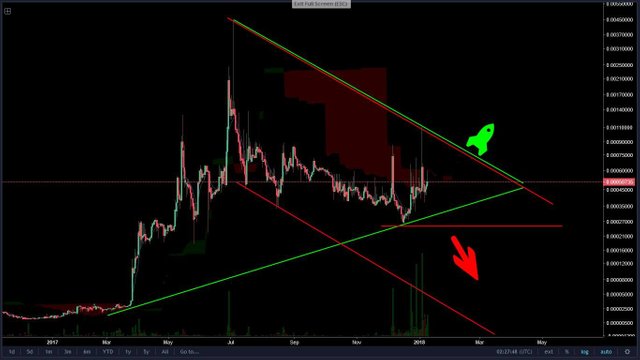
With that said, for sake of criticality, here also is an alternative scenario to consider, should there fail to be a breakout and the price starts dumping down, it could then fall within the red channel shown below, rather than breaking out above the green triangle. It always pays to expect the unexpected and be prepared for whatever happens. It looks like the low resistance to break would be 25000 for this to stay in its bear cycle. Current price is trading just around 50000.
One more word of caution. Because SPHR may be swapped for a new erc20 token at some time in the near future, you must consider that even if the price should rise as I anticipate, there is the possibility that if you are in the trade at the time when the swap takes place it could mean that your funds will be locked up for some time until the swap is complete. I personally do not know how swaps work, how long they take, whether Bittrex would notify its customers before this was about to occur, or what. It's just another data point to factor in, if you want to be in this trade or not.
Finally, here's a recent article from January 5th, Here's What We Think Is Driving Sphere with some more analysis of the fundamentals, that paint a more positive outlook on the future of the coin, than one would have gathered at first glance.
Quoting the article:
.... Of course, even against the backdrop of this relatively sparse level of communication, SPHR has managed to appreciate substantially over the last few weeks so, what’s driving the gains?
Management has long been communicating that it expects to transfer the current token over to what’s called the UBIQ network, which is a sort of upgraded Ethereum type smart contract platform, near term.
When this happens, SPHR tokens will be exchanged for an ECR20 compliant token and listed on major exchanges – starting with (reportedly) Bittrex.
This has – as mentioned – been in the works for some time but the recent action suggests it could be just around the corner. It would be a real watershed moment for the company and its coin holders if it plays out so, as far as the recent action is concerned, it looks as though its rooted in a degree of speculative loading in anticipation of this watershed moment coming to fruition.
So what’s next?
Comments and alternate views welcomed. Thanks for reading.
Great post bud absolutely love your analysis .Ill be sure to keep a close eye on Sphr .Could you have a look at my analysis and let me know how you feel.https://steemit.com/trading/@jsonkidd/ethereum-classic-technical-analysis
Thank you. I just left a comment over on your post. Looks good.
thanks bud appreciate it
Trade Update: I had anticipated there might be a breakout coming, and its been a few days now. The price dumped down yesterday along with the rest of the crypto market according to what I have heard is the FUD coming out of South Korea, but has bounced back and appears to be still following the trend-line up according to the hourly time frame I posted (above).
Already turning into a longer hold than I first anticipated, but I am still hodling. It looks to me like the the higher time frame indicators remain strong, while the lower ones had turned over the past few days they are starting to come around and line up again. Might be time for the breakout or it might mean this process repeats and we see it oscillating out for some days to come.
Trade Update: below is a 4-hour chart. SPHR continues making higher lows, as it moves up the trend line. Still waiting for price to start opening some strong candles above the longer green trendline for confirmation, if this thing really has legs.