BTC daily and 4h chart analysis
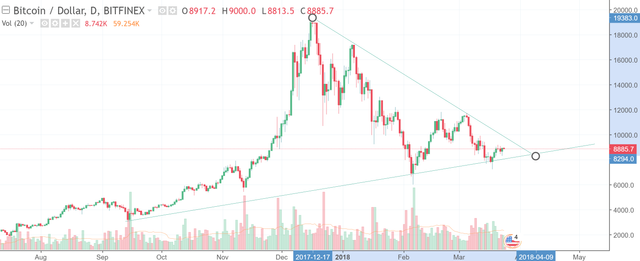
I'm still sitting out of BTC for the moment. I exited before it was rejected for a second time at the key 12k resistance level, which saw it fall to around 7.7k.
Looking at the graph below, assuming BTC continues to form this equilibrium on the daily, I want to see what happens on around 9 April to see which direction it breaks out. I'll most likely enter with a stoploss around 8.1k.

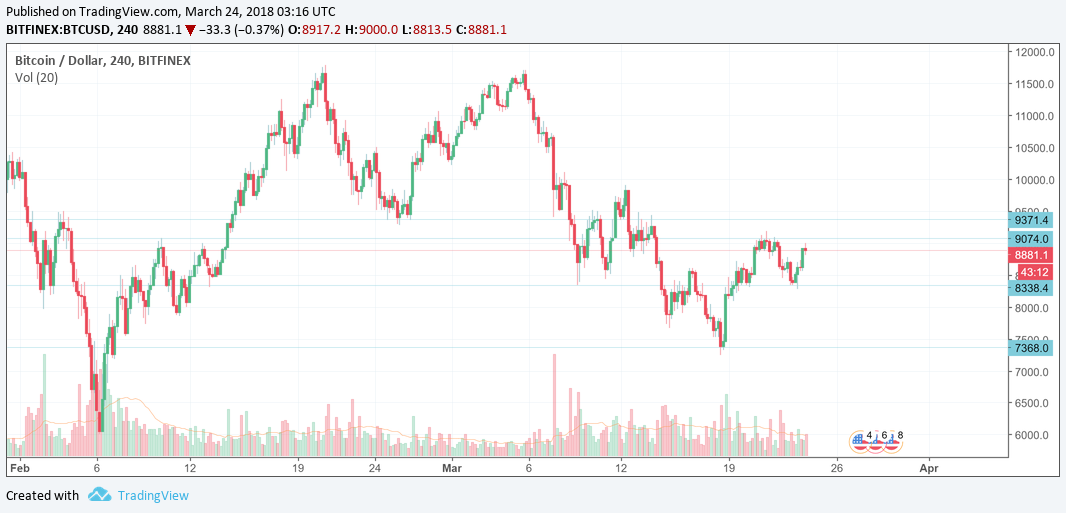
On the 4 hour, the equilibrium pattern is forming with lower highs and higher lows but there is not very strong support. There are probably some scalping opportunities, but the risk to reward isn't really worth it in my view. It will need to break through resistance levels at 9074 and 9371 to show it is breaking this downtrend.

Obviously do your own research. I'm a semi-professional trader but certainly not offering any advice or advocating one way or another what you should do with your own money.
Resteemed your post to my 1590+ active followers. To get free resteem follow @anupbose