Red Flags Everywhere!!! T.A. & A.I. point to insane market trend!
NOTE: For an update (play-forward) of this analysis, click on the Tradingview chart image above, then the triangular play button when you get to Tradingview. Enjoy and comment what you think!
Hey there trader friends, this is one of our most detailed and important Bitcoin analyses to date, taking both human and AI analysis into account, so let’s get to it!
Summary
- BTC is likely to drop another 30-60% over the next 4-12 months, possibly 18 months.
- Short-term cycle lows are expected in July and October 2018.
- The mid-July 2018 cycle low should be followed by a 3-8 week trading bounce. Then, another big wave down into early to mid October 2018.
- October could be “the low,” but based on our data we are thinking next year is more likely
- The final cycle low, or momentum lows are expected to be in February 2019 (A.I. low date), or June 2019 (pink cycle low), or possibly January 2020 (blue cycle low_
- Initial lower price targets are $4935, then $2967-2380 (or lower).
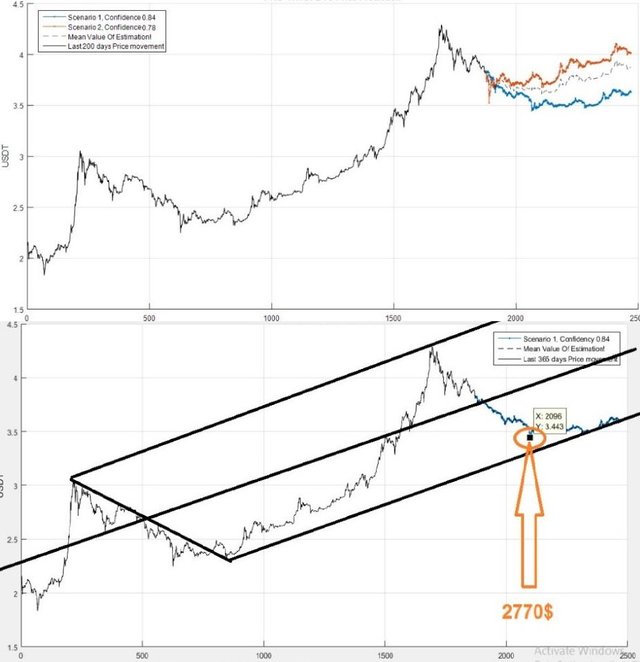
- A.I. project forecasts 12 month low @ $2774, due in February 2019.
- The deep learning A.I. project’s forecast is confirmed by Elliott Waves , Andrews Lines, Wolfe Waves , and a few other techniques shown here, most suggesting much lower prices ahead.
- BTC has broken its “low to low” support trend-line.
- Will likely close below the Andrews Median Line (orange pitchfork's mid line), which, would put Bitcoin -3.30% below the black dotted trend-line drawn off the lowest closing prices of 2018. Once broken, the first three price targets to the downside become quite likely.
A.I. Predictions

And here we can see the low AI target and the Andrew's pitchfork off the prior cycle are nearly perfectly aligned.
Time Cycle Caveat
We are working on pattern matching & comparison referred to as analog. This suggests an October 2018 low. That fits the secondary A.I model's forecast, but not the top performing algorithm's forecast (February 2019 low). Remember, two of the longer-term cycles are pointing to either a June 2019 low (pink cycle), or January 2020 low (blue cycle). Therefore, the October low this year seems less likely thus far, but not out of the question.
Price Targets
DISCLOSURE: This analysis is meant for educational purposes only. You trade at your own risk!
Cheers and best wishes, Michael Mansfield CIO
To listen to the audio version of this article click on the play image.

Brought to you by @tts. If you find it useful please consider upvoting this reply.
This post has received a 1.53 % upvote from @booster thanks to: @cryptoplayhouse.
I don't believe it at all. Look at this
I've seen many charts like this as well. With the parabolic moves made by bitcoin a linear scale has truly become an incomplete picture at this point. Re adjust to a logarithmic scale and you will still see cycle repetition but on a very different scale. Also, the A.I. analysis is not something we influence, it simply is what it is and we use it to bolster our analyses and trading. We don't assume it to be correct 100% of the time, we do however know it is impartial and thus invaluable.
good stuff, saw another post on tradingview that talks about a 3k target but much higher longer term target and a smaller time frame. While TA is what is, i think fundamental news is going to drive prices higher pretty soon. Anyway, helpful article. Thanks!
I tend to agree, while I absolutely believe in the merits of T.A. fundamentals can move the market outside of traditional patterns at the drop of a hat. The key in crypto trading is doing your T.A. but keeping your ear to the ground for News and being ready to flip positions on a dime!
Perfectly sound advice. Your article was very good. Following you now for more such content.
I do not understand the graph. crazy lines. I hope you are wrong and bitcoin will grow up the next 4-18 months