Bitcoin: end game for the 2018 correction
Despite murmurs of institutional money preparing to enter the cryptosphere, bitcoin has failed to find momentum. In my last post I outlined a scenario of an ABC zig-zag correction with a contracting triangle for the B wave. There were a number of additional factors to support this scenario:
- Declining volume throughout the triangle
- Elliott wave theory allows the E wave of the triangle to fail to reach the top line (possibly the case here)
- Negative reversal of the relative strength index (RSI) suggesting an impending downward move.
The triangle now appears to be breaking decisively downward.
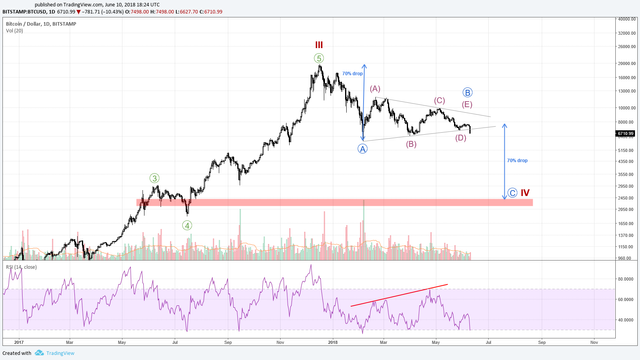
Figure 1. Bitcoin daily chart showing potential bottom of C wave.
Why a zig-zag?
It’s always important to bear in mind the longer-term perspective. One reason to suggest a sharp and deep correction is Elliot’s principle of alternation. Roughly speaking, if the wave two correction of an impulse sequence is sideways, the fourth wave will be sharp, and vice-versa. Taking the complex sideways correction in 2014 to be wave two of a cycle and the recent all-time high of December 2018 to be the top of the third wave, a long sideways correction like 2014 seems unlikely. Instead, we should brace ourselves for a comparatively short and sharp movement.
A precedent from 2016
Looking back at the price history of bitcoin, we can find a similar type of correction in 2016, which resulted in a 40% drop in the price of bitcoin.
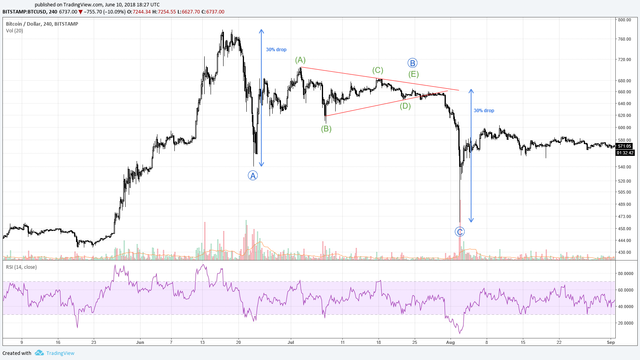
Figure 2. A contracting triangle as the B wave of a zig-zag correction in 2016.
As the chart shows, in this instance, the E wave also failed to reach the top of the triangle before breaking downwards in spectacular fashion. Note here that waves A and C of the zig-zag are of the same length: in this case, both resulted in a 30% fall in price.
Catching a falling knife
This leads us to the million-dollar question: where will bitcoin bottom out? The simplest scenario, based on Elliot rules (and supported by the precedent in Figure 2) would be a one-to-one correspondence between wave A and C of the zig-zag. (Note that a 0.618 correspondence is another possible scenario.) As the chart in Figure 1 shows, wave A, which began at the all-time high of 19.5k and ended at the low of 5.9k at the start of February this year, represents a fall of 70%. Taking the recent 7.7k high as the orthodox top of the contracting triangle, a 70% fall would take bitcoin down to around 2.3k.
This might seem far-fetched. However, if we take the correction from 3k to 1.8k as primary wave four of cycle wave three (there are good reasons for doing so, which I plan to explain in a separate post looking at the long-term history of the price of bitcoin), such a scenario accords well with the guideline that fourth wave corrections often terminate in the region of the fourth wave of the previous degree of trend.
Capitulation may soon be in sight.
Disclaimer: I am not a financial adviser. Nothing in this post should be taken as financial advice. All content is provided for information purposes only.