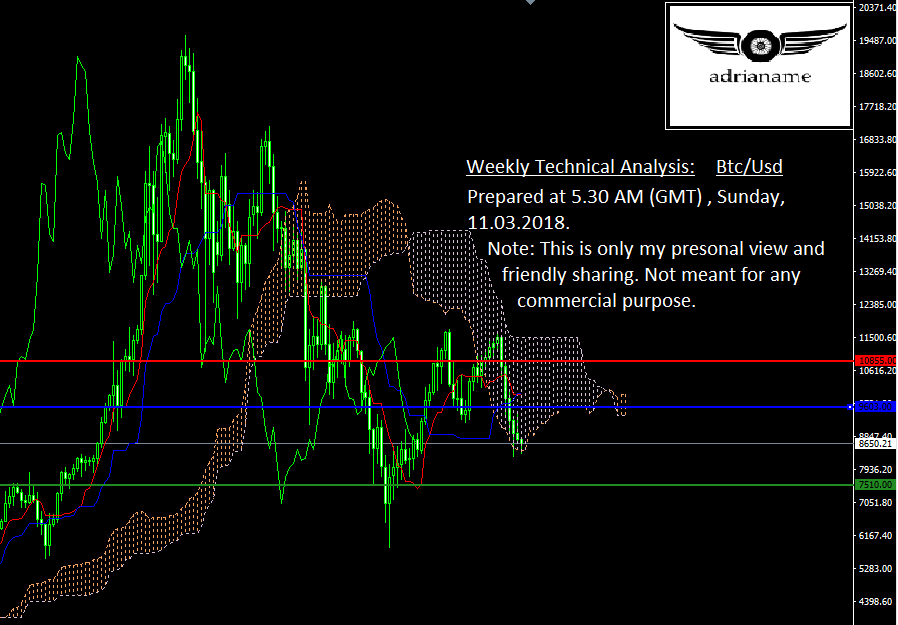
Btc Usd Weekly Technical Analysis.

I prepared this chart at 5.30 AM (GMT), Sunday, 11.03.2018.
When I prepared this chart, The market level is at 8683.0.
It is bellow the weekly pivot level: 9603.0.
I took 7 Technical Indicators and 12 Moving Averages in to count.
Out of 7 technical indicators, 5 indicates bearish and 2 indicates the bullish trend.
Out of 12 moving averages, 6 indicates bearish and 6 indicates the bullish trend.
Considering above result, I prefer to say the present trend is neutral.
As per my expectation, the market may move between immediate support level, 7510.0 and Pivot level, 9603.0.
As it is bellow the pivot level, 9603.0, there are more chances to drop down to the immediate support level, 7510.0.
If it is succeeded to cross the pivot level, 9603.0, upwards, we can't deny chances to touch the immediate resistance level, 10855.0.
As the market is in neutral trend, still I am waiting for proper signal to open my trade deals.
Note: this is only my personal move and friendly sharing. It is not meant for any commercial purpose.
For future viewers: price of bitcoin at the moment of posting is 8780.00USD
Thanks for your update. I welcome and apprciate such updates please.
Hi, I followed you :)
Please follow back and we can help each other succeed! @hatu
My recent post
Very detailed and useful analysis I apprciate this much of efforts taken to nerrate the accurate position of btc market.
It will be more helpful if you post such a details analysis for all crypto currencies. Much useful for traders.