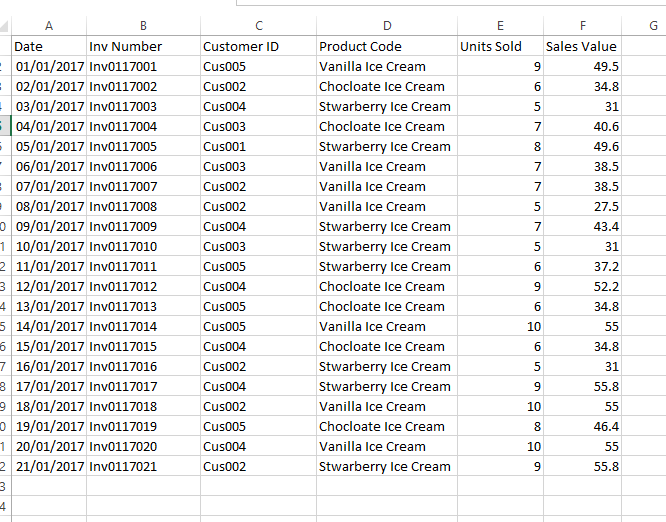
#data-analysisUnmoderated tagAll postsTrending CommunitiesSteemitCryptoAcademyNewcomers' Communityআমার বাংলা ব্লগKorea • 한국 • KR • KOSTEEM CN/中文AVLE 일상Steem AllianceWORLD OF XPILARSteem POD TeamBeauty of CreativitySCT.암호화폐.CryptoTron Fan ClubExplore Communities...#data-analysisTrendingHotNewPayoutsMuteddaprado1999 (70)in #spreadsheet-s20w3 • 5 months agoSEC | S20W3 | Data Analysis with Excel; Charts and data analysis techniques)edited with canva Hello friends and welcome to my article in the SEC: S20/W3 I will be sharing my…pythoncoaching (32)in #java-coding • 2 years agoData Analysis Vs. Data SciencePrior to swimming in too far on why Python is so fundamental for information examination, it's significant first to…jerryboy4luv (55)in #business • 4 years agoLET'S HELP YOUR BUSINESS STAND OUTDo you need any help in upgrading your business or do you want to build from scratch? (1) Do you need websites like…ifeoluwa88 (67)in #steemhunt • 6 years agoHAPPYFOX - Live Chat Software that works hard for youHAPPYFOX Live Chat Software that works hard for you Screenshots View Image View Image…iqbaladan (65)in #steemhunt • 6 years agoLoop Pulse - A Data Analysis PlatformLoop Pulse A Data Analysis Platform Screenshots View Image Hunter's comment Loop Pulse is a…seohj (30)in #kr • 6 years ago상장폐지 예측4(Performance)_Data Analysis/Analaze Delisting Stock드디어 상장폐지 예측 마지막 포스팅입니다. 지난 포스팅까지 데이터를 분석모델에 적용시켜 보았습니다. 오늘은 마지막으로 데이터를 바탕으로 예측모형을 만들고 예측성과를 비교해보겠습니다. 예측 성과에 앞서…seohj (30)in #kr • 6 years ago상장폐지 예측1(데이터수집)_Data Analysis/Analaze Delisting Stock저는 데이터 분석을 공부하는 학부생입니다. 지금까지 약 1년 넘게 공부하는 동안 여러 분석을 진행하였지만 오늘은 여러분께 제가 한 분석를 소개하려 합니다. 주제는 상장폐지 에관한 분석과…ceojohn (43)in #loplat • 6 years ago[Offline Behavior Insights] 역대급 폭염! 오프라인 비즈니스에 어떤 영향을 미쳤을까?본 포스팅은 로플랫(loplat)의 CEO이며 이 계정의 주인인 @ceojohn이 아닌, 그와 함께 일하고 있는 yurimkoo가 작성한 것입니다. 로플랫 데이터팀은 오프라인 빅데이터를 활용하여 사용자의 행동…ceojohn (43)in #loplat • 6 years ago[Offline Behavior Insights] 영등포 상권내 백화점 이용 행태 분석본 포스팅은 로플랫(loplat)의 CEO이며 이 계정의 주인인 @ceojohn이 아닌, 그 와 함께 일하고 있는 jungjin이 작성한 것입니다. 로플랫 데이터팀은 오프라인 빅데이터를 활용하여 사용자의 행동…whatspal (-3)(1)in #art • 7 years agoThe Making of Great HypothesisHow Bill and Melinda Gates’ favorite book Factfulness will leapfrog your data science practiceMotivationSo far, data…whatspal (-3)(1)in #art • 7 years agoVisualizing Data with Pairs Plots in PythonHow to quickly create a powerful exploratory data analysis visualizationOnce you’ve got yourself a nice cleaned…whatspal (-3)(1)in #art • 7 years agoSeattle’s OneClick.ai — Bringing AI a Click CloserOneClick.ai, a startup founded by two former Microsoft engineers in Seattle, is on a mission to make AI more…datatreemap (53)in #python • 7 years agoIntro to Data Analysis / Visualization with Python, Matplotlib and Pandas | Matplotlib Tutorial!This is a great channel for beginners in data analysis using Python ! These are some of the points the tutorial covers…whatspal (-3)(1)in #art • 7 years agoData Visualization with REPODS:Finally, going to the hands-on example, the workflow of creating an infograph can be divided into 4 steps…multiplier (26)in #mosaic • 7 years agoHow Data Can Help People Make Better Decisions Traditional equity metrics don’t apply to cryptoassets according to former equity research analyst, now Mosaic founder…elguille (57)in #utopian-io • 7 years agoCustom Maximum Likelihood Models in Python with Statsmodels Statsmodels is a powerful python library that to this day has many different statistical methods implemented. This…dr-strano (45)in #utopian-io • 7 years ago#ita posts: trends, distribution & rewardsDetails The proposed analysis aims at providing the first outline of the italian community gathered under the…slowdown (32)in #kr • 7 years ago나라별 GDP와 혼인율의 상관 관계?안녕하세요. @slowdown 입니다. GDP가 높은 나라일 수록 혼인율이 높을까요? 제가 수집 정리한 자료를 바탕으로 확인해 보았습니다. 국가별 GDP 대비 혼인 인구 비율(%) 먼저 세계 각…andrewzhu (46)in #data-analysis • 8 years agoFour levels of Data AnalysisLevel 1, Reporting and Monitoring Data and result in this level reflect basic facts of raw data. it tells what is…paulag (73)in #excel • 8 years agosteemCreated with Sketch.Excel’s BI Tools: An Introduction to PowerPivotPivot Tables were once hailed as the most powerful feature of Excel. They allow slicing and dicing of a data table so…