Corrosion: Pourbaix Diagram
Intro
In previous post, it has been mentioned that among the factors that can affect corrosion are pH and potential (voltage). Under certain pH and potentials, a metal can become unstable. Knowing these 2 parameters will be beneficial for anyone wishing to estimate whether corrosion can occur or not under different pH and potentials.
Pourbaix Diagrams
A useful diagram for corrosion estimator based on pH and potential is called Pourbaix diagram. Pourbaix diagram was created by a Belgium corrosion scientist named Pourbaix. It is basically a potenial-pH diagram, which represents the stability of a metal as a function of potential and pH. The diagram is constructed based on Nernst equations and metals & its species solubility in equilibrium state. In this diagram, we can see 3 different regions which are:
- Immune region (thermodynamically stable, no corrosion)
- Corrosive region (active state)
- Passive region (forming passive layers, inhibiting corrosion)
Before we get into the details of the diagram, let us find out the diagram's objectives:
- To know which pH and potential changes will prevent corrosion
- To estimate corrosion product compositions at different pH & potential
- To know the directions of various reactions at different pH & potential
Ok, now let's get into the details/characteristics of Pourbaix diagram:
- Hydrogen and oxygen lines are drawn in dotted line.
- The Pourbaix diagram is shown for equilibrium conditions at 25 deg C.
- The concentration of metal ions is assumed to be 10^-6 mol. (Note: lower concentration shouldn't cause corrosion)
- X-axis is showing pH value while Y-axis is showing redox potential vs SHE value. (SHE: standard hydrogen potential)
- Horizontal lines represent electron transfer reaction which are pH independent.
- Vertical lines doesn't represent electron transfer reaction, which are pH dependent.
- Sloping lines give redox potentials of a solution in equilibrium with hydrogen and oxygen, respectively.
- Oxidizing power increases with increasing potential.
Pourbaix for Water
The redox reactions for water can be referred from EMF series. One of the reactions is (1/2)O(2) +2H(+) + 2e(-) --> H(2)O, which has a potential of 1.23V. By using this potential value, knowledge from pH applicability of Nernst equation, the Nerst equation becomes: E = 1.23 - 0.059pH.
Another redox reaction for water is 2H(+) +2(e) --> H(2) , which has a potential of 0V . Using similar technique as above, the Nerst equation becomes: E = - 0.059pH.
These 2 equations are then plotted on the Pourbaix diagram. The diagram is shown as below:
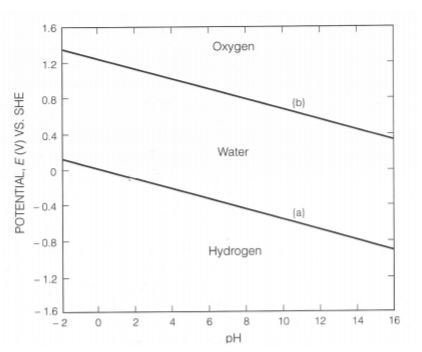
The info for the above diagram is such that:
- above line (a), water is stable and any H(2) present is oxidised to water
- below line (b), water is stable and any O(2) present is reduced to water
- above line (b), water is unstable and oxidize to give O(2)
- below line (a), water is unstable and reduce to H(2)
Now that we have formed the lines for water, there is one thing left to do, which is to add line for metal. For iron, the Pourbaix diagram looks like this:
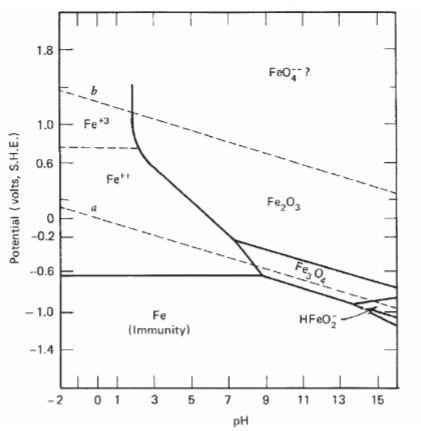
The lines are formed by using the same method as mentioned above in addition with Gibbs free energy calculation(for simplicity, it is not shown here). Region of stability for iron is at the bottom part of the diagram, which lies about below -0.6V (some other sources mentioned as below -0.44V). Several important observations from the diagram are:
- Iron will be unstable in water, no matter what are the pH and potential. That is, iron will corrode in water.
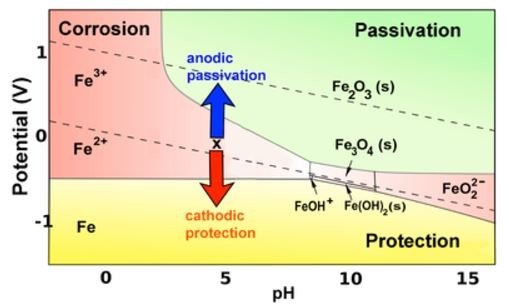
- Iron can be protected by passivation [coating with Fe(2)O(3)] or cathodic protection [coupled with more active metal that has larger negative potential].
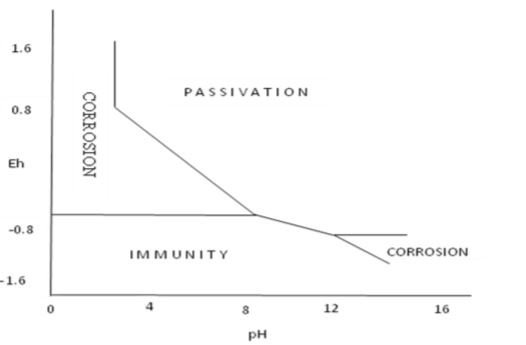
We can relate real world phenomenon with Pourbaix diagram. For example, bridge's components that are submerged in water or mud will tend to corrode terribly than other bridge components in air. This is because the mud or water has potential(voltage) that is close to H(2) line, where iron,Fe can corrode to Fe(2+). The corroded and non-corroded regions for iron,Fe in Pourbaix diagram is shown below:
OR in simple form:
The Pourbaix diagram do have some limitations such as follows:
- The diagram is only applicable for 25 deg C. Can't predict corrosion at higher temperature.
- It tells whether corrosion happens or not but not the corrosion rate.
- Only applicable for pure metals. Not applicable for alloys or impurities effect. Hence, not really practical for engineers.
That's all about Pourbaix diagram. I hope readers may learn something from this post.
Thank you.
Cheers,