Corrosion: Evans Diagram
Intro
Based on EMF series and galvanic series, we can notice that the common parameter for both series is potential (voltage). One may wonder, how about current? Does current play a role too in corrosion? As a matter of fact, it does but current alone is not the main parameter. The main parameter is called current density, which is a measure of current per unit area.
Current Per unit Area
Current per unit area plays a major role in affecting corrosion rate. As can be seen from my previous post, current flows from cathode to anode, which is opposite to the flow of electron. Let's say we have a cathode which is bigger than the anode. As the current flows from big area of cathode to the small area of anode, the total current has to be distributed to the surface area belonging to the small anode. Since the large amount of current has to flow to the anode, the current per unit area is high at anode. This will force the anode to accept high flows of current. The effect is concentrated over a small area, which leads to higher corrosion rate.
Evans Diagram
Remember that in Pourbaix diagram, potential is plotted against pH. For Evans diagram, the y-axis remains as potential but the x-axis is now the current density in logarithmic scale. Typical Evans diagram for zinc in acid solution is shown as below:
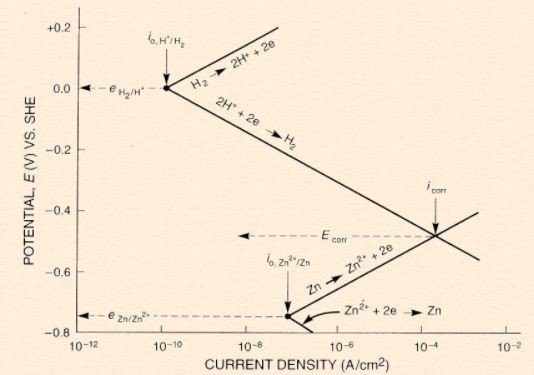
From the above diagram, notice that there are 4 slopes existed, 2 comes from Zn & 2 comes from H(2). The 2 slopes from each element corresponds to oxidation (sloping up) reaction and reduction (sloping down) reaction. Once the Zn is connected/immersed in hydrogen, both of them experience activation polarization along their lines. When the 2 lines meet, the corrosion potential (E_corr) & corrosion current density (i_corr) will be known. From here, the corrosion rate of zinc can be estimated using current density value (i_corr). Do take note that the slope of Evans diagram is usually obtained experimentally, although Tafel equation may used to construct the slopes (not explained due to complexities). For everybody's info, the experimentation work to obtain Evans diagram involves conducting potentiodynamic polarization measurement, using a machine called potentiostat. Please refer here for further reading on the details.
Apart from referring to Evans diagram, E_corr & i_corr can also be obtained from equations. For example, the equations for zinc and hydrogen will be in the form as followed:
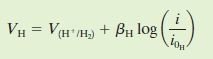
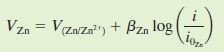
Where B and i(o) are constants for each cell. By equating V(H) & V(Zn), i_corr can then be obtained.
Polarization (change in voltage)
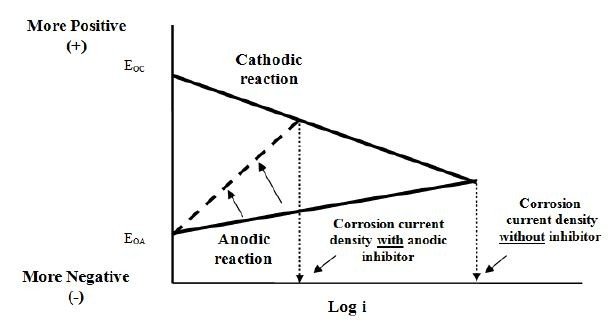
Now that we are familiar with Evans diagram, we know that corrosion rate can be reduced when i_corr is lowered. This can be achieved by 2 methods, either by increasing the slope of anodic reaction (anodic inhibitor) or increasing the slope in -ve direction for cathodic reaction (cathodic inhibitor).
Anodic Inhibitor
We can use anodic inhibitor to increase the slope of anodic reaction. Some examples of anodic inhibitor would be:
- Oxidizing anodic inhibitor: Chromate, Nitrite (can passivate steel without oxygen)
- Non-Oxidizing anodic inhibitor: Phosphate, Tungstate & Molybdate (required oxygen to passivate steel)
The effect of changing the anodic reaction can be seen as below:
Cathodic Inhibitor
Instead of changing the slope of anodically, we can also change the slope cathodically to reduce the corrosion current density as shown in the figure below:
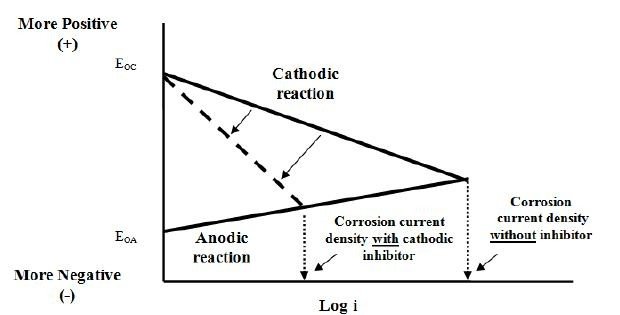
Examples of cathodic inhibitor are arsenic, bismuth and antimony compounds. However, there are drawbacks with this method. The compounds can cause hydrogen blistering of steel and also easier to experience hydrogen embrittlement. This may occur because cathodic inhibitor prevents hydrogen atom formation, which in turn causing concentration of hydrogen atoms at the surface of the metals which will then absorbed into the steel. Hydrogen atoms then combined to form hydrogen molecules inside the steel. Since hydrogen molecules do not diffuse through steel, they tend to gather at voids or defects and the creating pressure which may reach pressure up to 7k MPa to cause pitting/damage.
Anodic Protection
Another type of corrosion control is by maintaining a metal in the passive region by means of externally applied anodic current. By using an external power supply, it is possible to achieve passivity by altering the potential. The Evans diagram for such metals will typically has a S-shape like this:
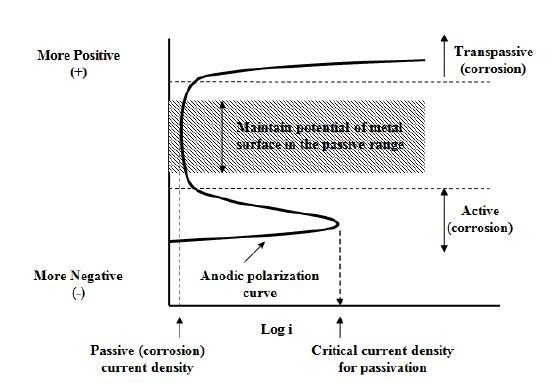
Typical example for this would be a steel storage tank for sulphuric acid (example in a chemical plant).
Point to take note
As of now, we have covered on brief explanation on Evans diagram & Pourbaix diagram. One important point to take note is that, Pourbaix diagram won't able to tell the rate of corrosion. It gives us information on whether a reaction is feasible (possibility of corrosion). Meanwhile, Evans diagram is able to tell us the corrosion rate. Do take note that Evans diagram deals with the kinetic aspect of corrosion while Pourbaix diagram deals with thermodynamic aspect of corrosion.