Bitcoin Struggles to Pass $11K Amid Low Volumes

Bitcoin (BTC) passed above the $11,000 mark this morning, but is having a tough time holding on to the gains amid low trading volumes.
As of writing, CoinDesk's https://www.coindesk.com/price/ (BPI) had dropped slightly to $10,890 - up around 19 percent from the weekly low of $9,304.68, and 5 percent over the last 24 hours.
A look the https://coinmarketcap.com/currencies/bitcoin/#markets on data site CoinMarketCap shows trading volume is highest in BTC/USDT (bitcoin-tether) pair listed on the cryptocurrency exchange OKEx. Further, three out of the top 10 exchanges by volume offer BTC/USDT. So, it appears investors are using tethers to trade bitcoin - perhaps due to the USD-pegged token's low volatility.
Meanwhile, 24-hour https://coinmarketcap.com/currencies/bitcoin/historical-data/ stands at $8.4 billion - the highest since Feb. 21. However, that number doesn't look particularly impressive when compared to the average daily trading volume of $13.4 billion seen in January and $13.2 billion seen around the price peak in December. Further, the 24-hour volume is largely unchanged from the February average daily volume of $8.25 billion.
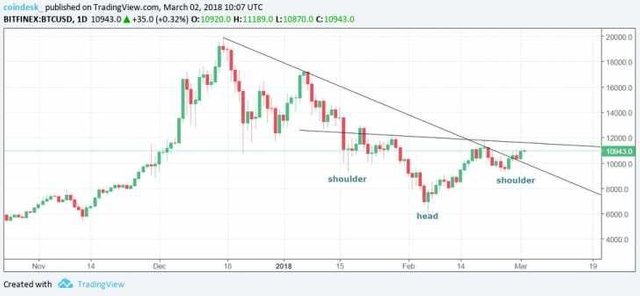
While stagnant volumes are a cause for concern, the odds of a bullish inverse head-and-shoulders breakout have improved, price chart analysis indicates.
Daily chart (linear scale): Descending trendline breached

The descending trendline (drawn from the Dec. 17 high and Jan. 6 high) resistance has been breached, using the https://www.investopedia.com/terms/l/linearscale.asp (also known as arithmetic scale), signaling a bullish break.
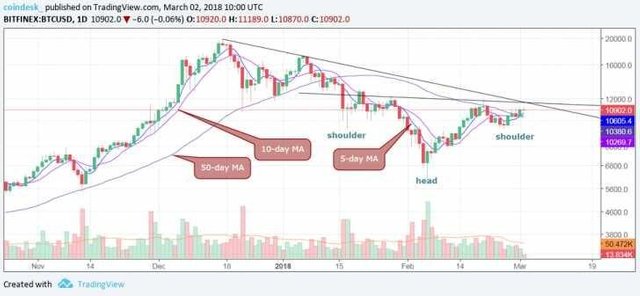
Daily chart (log scale): Trendline resistance intact, BTC falls back below $11,000

On the above chart (prices as per Bitfinex), the descending trendline resistance shifts higher to around $11,600 due to the https://www.investopedia.com/terms/l/logarithmicscale.asp
Since BTC has moved by a large percentage over the last year, log price scale is preferable as it plots two equal percent changes as the same vertical distance. So, regardless of where we are on the graph (at $2,000 or $20,000), a significant percentage move will always correspond to a significant visual change.
That said, a significant majority of investors use the linear scale and hence, it could be said that an upside break of the descending trendline occurred earlier this week.
Further, the bullish 5-day MA (moving average) and 10-day MA cross on this chart also favor the bulls, as does yesterday's close (as per UTC) above the 50-day moving average (MA). And, last but not least, the relative strength index (RSI) has moved higher, indicating scope for an upside move in BTC prices.
However, yesterday's price gains were not backed by strong volumes and the retreat from the intraday high of $11,189 to $10,900 seen today has neutralized the immediate bullish outlook.
View
A high volume break above $11,610 (inverse head-and-shoulders breakout) would open the doors for a rally to $17,000-$17,400.
Meanwhile, a drop below the descending trendline support of $10,000 (on the linear chart) would signal bullish invalidation.
Bearish scenario: As , https://www.coindesk com/consolidation-mode-bitcoin-awaits-decisive-move/ a daily close below $9,280.4 (Feb. 25 low) could yield a sell-off to $6,500-$6,000.
Chart image via Shutterstock
The leader in blockchain news, CoinDesk is an independent media outlet that strives for the highest journalistic standards and abides by a strict set of editorial policies. Have breaking news or a story tip to send to our journalists? Contact us at [email protected].
Disclaimer: This article should not be taken as, and is not intended to provide, investment advice. Please conduct your own thorough research before investing in any cryptocurrency.