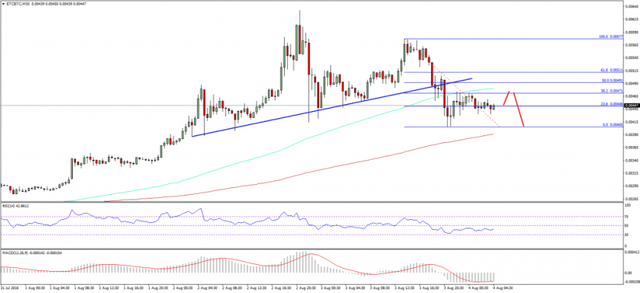
Analysis Prices Ethereum Classic 08.04.2016

Price Ethereum Classic trades to the downside. Probably, ETC can continue the downward movement.
Key points
Price Ethereum Classic after rising against the US dollar trades on the slide.
Dedicated yesterday a bullish trend on the ETC / BTC hourly chart (Simplefx data) was broken, and opened the doors for large losses.
If the recent decline will continue, there is a chance to get a significant loss in the short term.
Price Ethereum Classic trades to the downside. It seems, ETC can continue the downward movement.
Support prices Ethereum Classic
Price Ethereum Classic ETC fell yesterday, testing the support trendline and then rose slightly. However, as mentioned yesterday, at the moment it is not recommended to buy the UTS. The result is clearly visible on the chart, indicating that these recommendations are correct. Price lowered and consequently broke yesterday's bullish trend highlighted in the ETC / BTC hourly chart (Simplefx data).
Once there is a breakthrough level of support trend line, there has been a sharp downward movement, which resulted in a couple of ETC / BTC to 0.004 BTC. The new low has been formed at 0.00405 BTC, and now the price is trying to recover. Initial resistance is at the top is about 38.2% Fib from 0.0057 BTC to 0.00405 BTC.
Technical Analysis Prices Ethereum Classic
The main resistance is about 100 hourly moving average, which is also located just around 50% Fib from 0.0057 BTC to 0.00405 BTC. If a pair of ETS BTC continue correction upward, she could face sentences near the 100 hour moving average. One can consider selling in the short term, but with caution.

All MACD - MACD indicator is in bearish zone, indicating the possibility of significant losses.
All RSI - RSI is well below the level of 50, indicating a downward trend
The main support level - 0.0040 BTC
The main resistance level - 0.0048 BTC
Keep up the great work @basay007
Upvoted
Simply Great Information and Presentation
Can we short etc anywhere?
Technically 'no' but there is a ETC/ETH pair on poloniex.com. When the pair goes down, you sell ETC and buy ETH and make money. Best of luck trading !
-Epic
Upvoted