Civic (CVC) Technical Analysis - Countdown till...
Technical Analysis depends on market history to determine important landmarks at which to place fibonacci levels, trend lines, support and resistance. It is very difficult, dare I say impossible? to chart these fresh ICO coins until they have established some market history. That said, here is a look at Civic over the last few days.
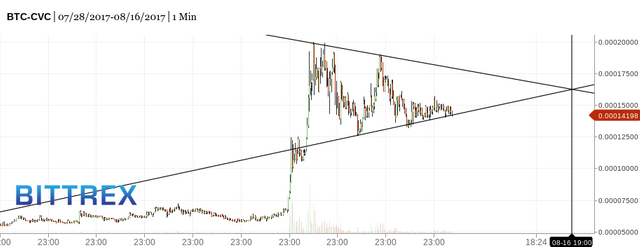
The daily chart is less than helpful, so I dropped down into the hourly to try and guage the support and resistance. As you can see in the chart above, we are caught in a compressing triangle (similar to Gold over the last few years). Assuming the rising support line holds, this triangle converges on 8/16 at 9pm. We can expect a breakout up or down at this time. With the current CVC sentiment being very bullish, I would expect a run up to the massive Sell wall at 0.0002. (Thanks @revnissan https://steemit.com/@revnissan for pointing that one out!)
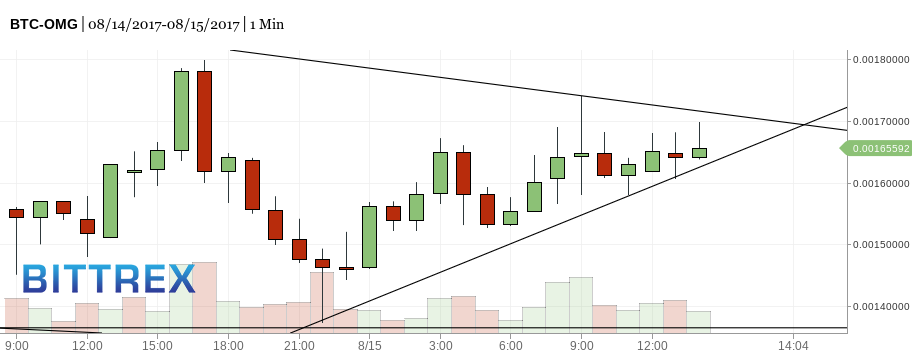
In fact, I noticed the same pattern in OMG 2 days ago. I posted this chart on facebook regarding this and moved some of my holdings into OMG, as well as my friends. We have done quite well on the break out and continue to hold.
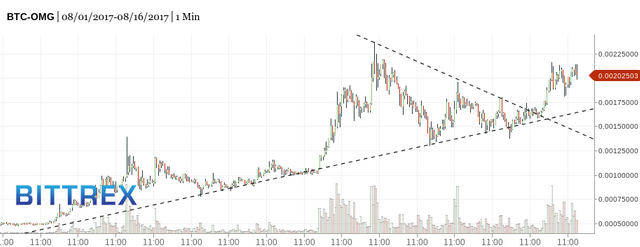
Current OMG Chart (Zoomed Out):
Goodluck. Have Fun. Take Profits.
(And feel free to throw me a bone. I will start posting regular TA charts. Feel free to request charting.)
BTC: 1NrgW8ZJj6pfmU5sDnjsLs2zgG9kd9kEDG
-JTtheAT
There is a huge sell wall at 0.0002. You can see it on the bittrex order book. I can only hope that the upcoming breakout not only tests but clears this wall.
If this happens, I would expect a run to the higher extension. It is equally possible that we attempt to break the wall, hit the lower extension and get knocked back down into consolidation.
I was asked on the Crypto Facebook Group about targets, so I posted some fibonacci extensions as seen here: https://www.facebook.com/groups/218612071968287/permalink/282767992219361/
I've always been a fundamentals value investor which is like trying to put a square peg in a round crypto hole.
What does TA say about BNT, BAT and SNT?
I chose those 3 because Bancor has been around. BAT is relatively new and SNT was just born.
It would provide some perspective of what TA analysis can do in 3 different scenarios.
Let me run some charts. I'll have this all for you in a new post tonight. SNT daily signals are live for sure. I sold off all my SNT when I saw a bearish pinbar AKA shooting star on 8/10/17
Same chart signal was on Stratis that same day and I had had like 90% in strat but sold it right before its big selloff. So, the signals are starting to work on the new coins because there are more people.
This is why only recently, I've stated charting them.
https://steemit.com/tenx/@jttheat/crypto-coin-technical-analysis-by-request-bnt-bat-snt